Web console (serve-ui)
faucet serve optionally serves an embedded browser-based web console at /
when built with the serve-ui Cargo feature. The console gives you a visual
interface for the same HTTP API that curl or an orchestrator would use —
useful for ad-hoc runs, browsing logs, and exploring connector schemas without
leaving a browser tab.
The console is a thin static single-page application bundled into the binary via
rust-embed. There is no separate deployment and no network call during startup.
Want to see it populated in one command? The Try it locally quickstart builds the CLI, runs a battery of demo pipelines, and leaves this console up with Runs, Datasets, Lineage, and Templates already filled in — the screenshots below are from it.
Enabling the feature
# Install with the embedded console (add serve-ui to your --features list)
cargo install faucet-cli --features serve-ui

# Or build locally
cargo build -p faucet-cli --features serve-ui
serve-ui implies serve, so you do not need to list both. The full
aggregate already includes serve-ui.
Once built, start the server normally:
FAUCET_SERVE_AUTH_TOKEN=s3cret faucet serve --listen 127.0.0.1:8080
Then open http://127.0.0.1:8080/ in a browser.
Token flow
The static shell at / is served without authentication so the browser can
load the page before it has a token. All /v1 API calls that populate the
console’s data are bearer-gated as usual.
On first load (or after a 401) the console prompts you to paste the bearer
token (the same value as FAUCET_SERVE_AUTH_TOKEN / --auth-token). The token
is stored in browser localStorage and sent as Authorization: Bearer <token>
on every subsequent /v1 request. A key-icon button in the top bar lets you
update or clear it at any time.
The console then asks GET /v1/whoami who the token belongs to, shows the
principal and role beside the key icon, and hides what that role cannot do. A
viewer (shown as read-only) sees no Submit, Run, Cancel, Delete, Launch or
Deprecate controls; an operator can submit and trigger runs but not
register, launch, roll back, deprecate, assign channels to, sync or delete
templates, which is admin work. Hiding a control is only a convenience: the
server refuses the action either way, and if a token loses a role mid-session
the next refused call makes the console re-read it and redraw.
Security: the bearer token is as sensitive as the API itself — anyone who obtains it can submit arbitrary pipeline configs with the server’s identity (see the security model). Serve the console only over localhost or a TLS-terminating proxy; never paste a production token into a browser tab on a shared machine.
Views
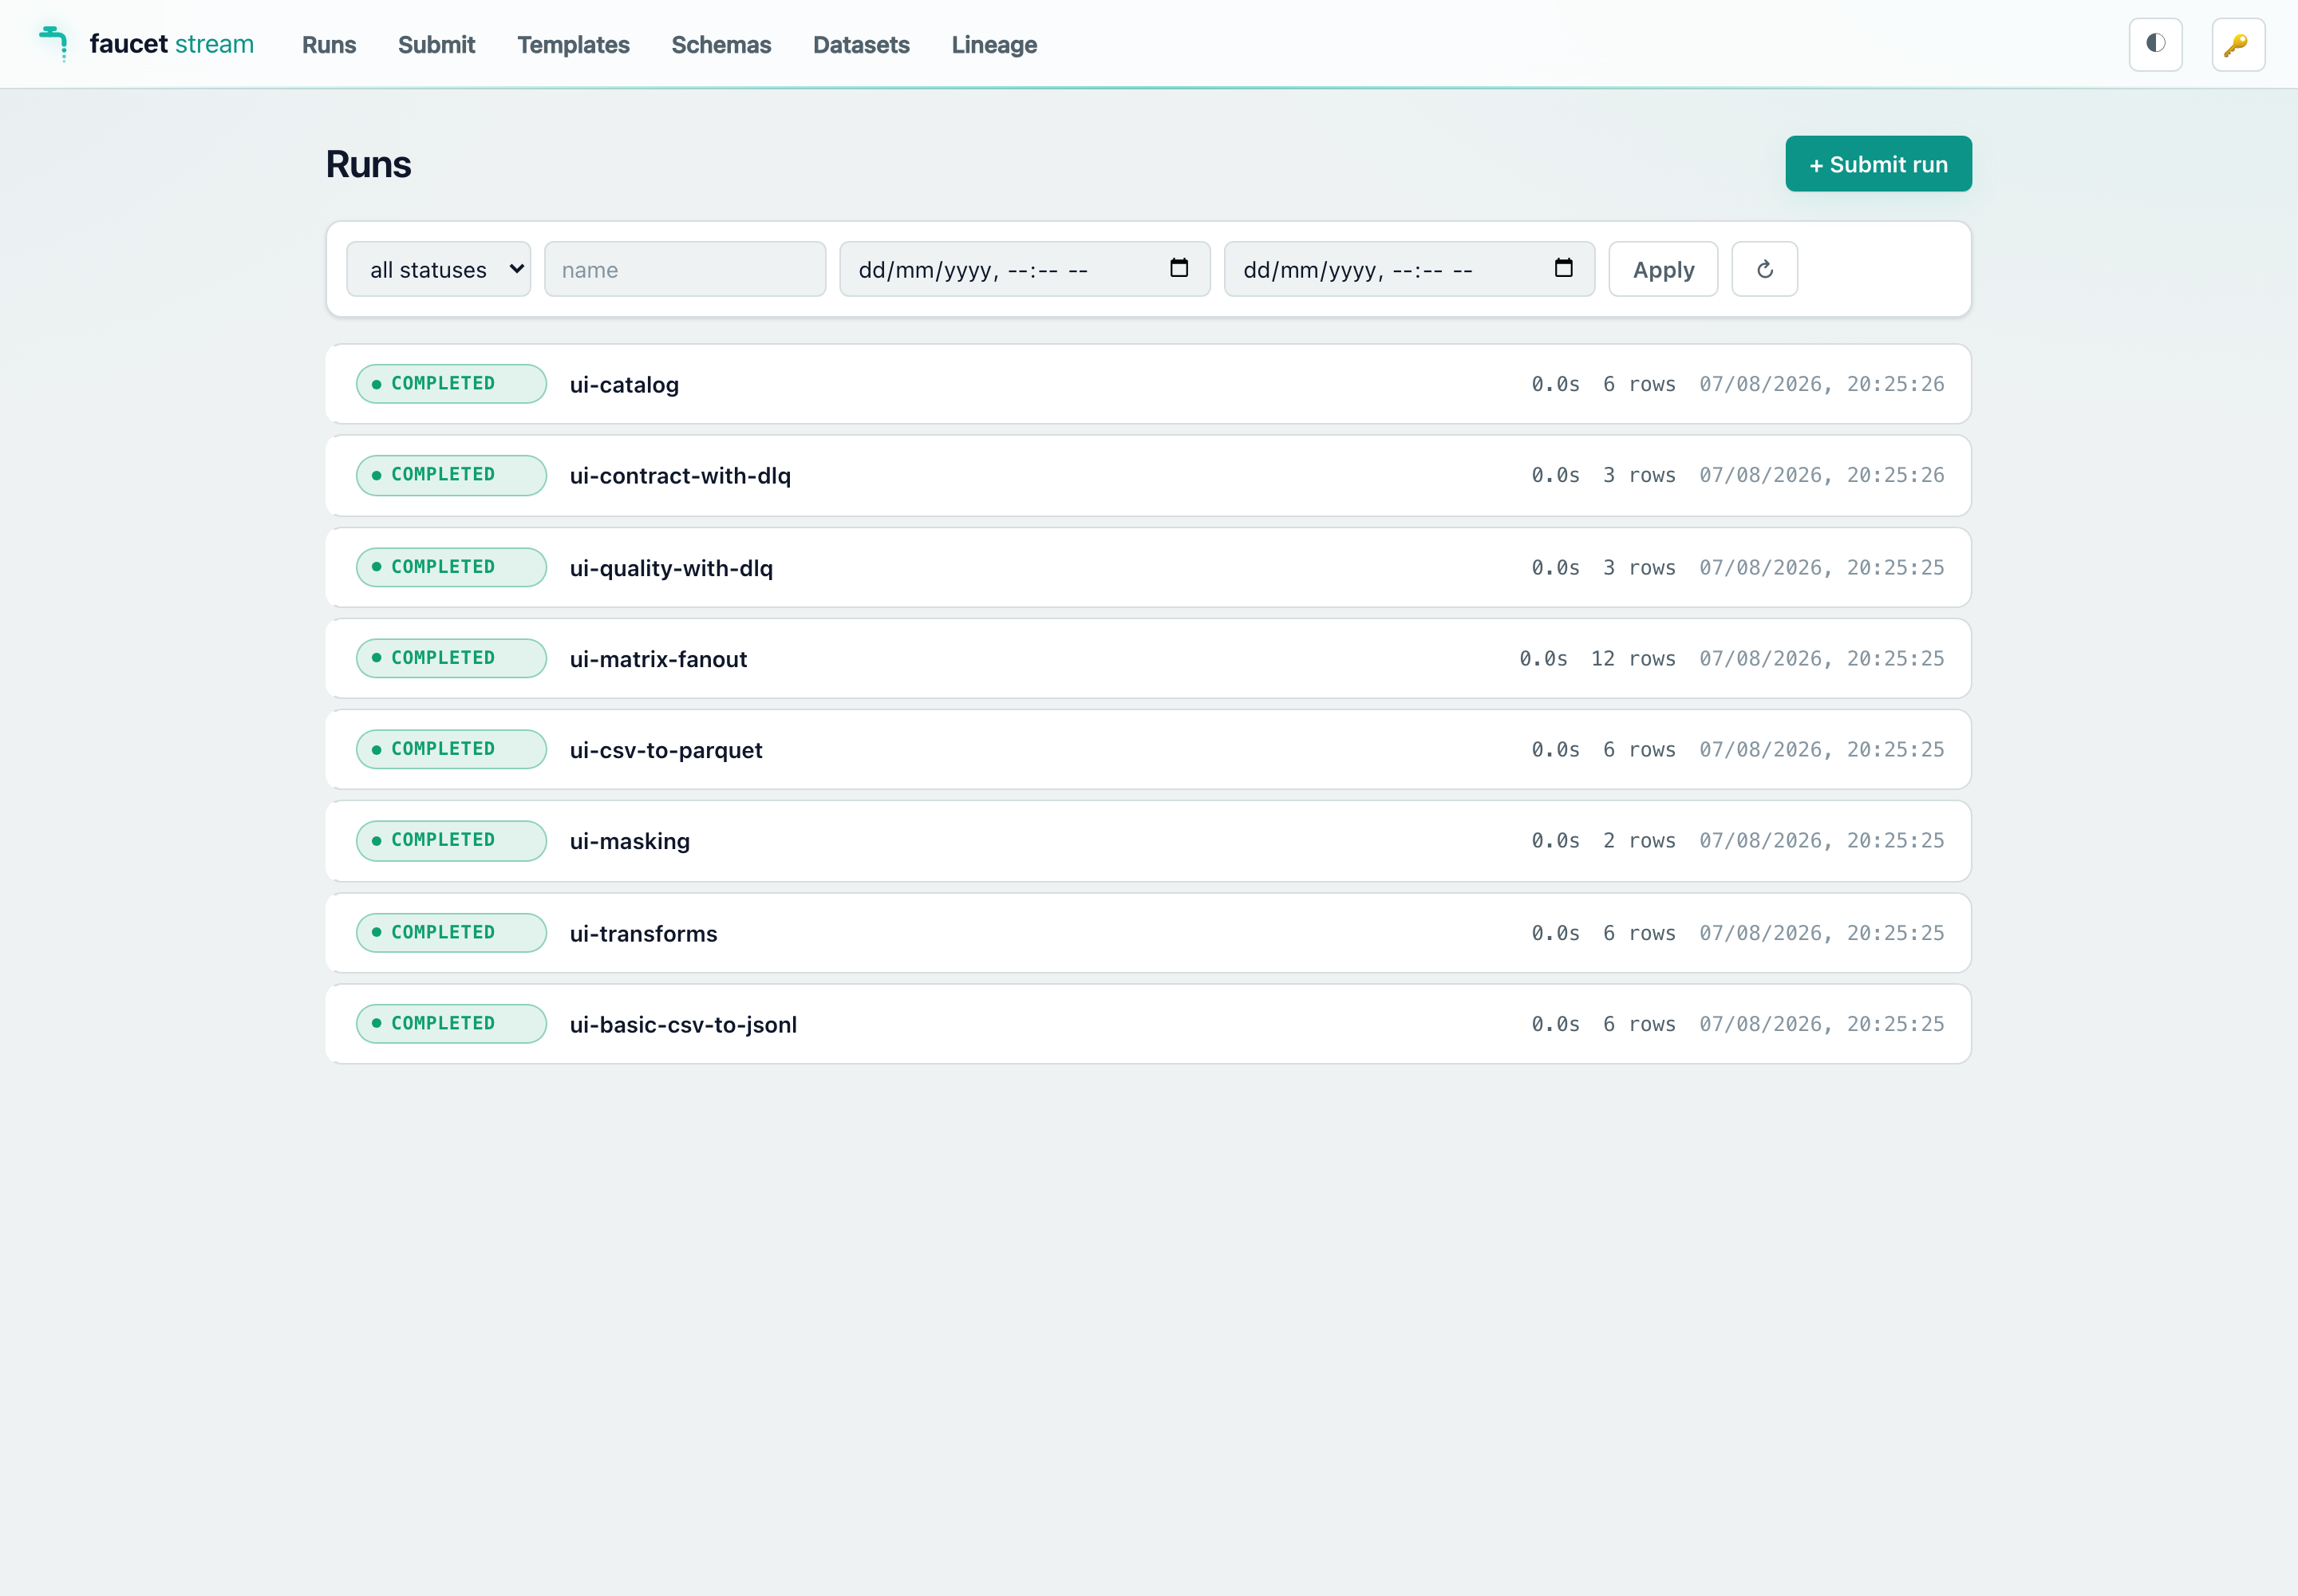
Runs dashboard
Lists all runs with live status badges. You can:
- Filter by name, status, or time range.
- Page through history.
- Click any row to open the run detail view.
- Click + Submit run to go directly to the Submit view.
Run detail
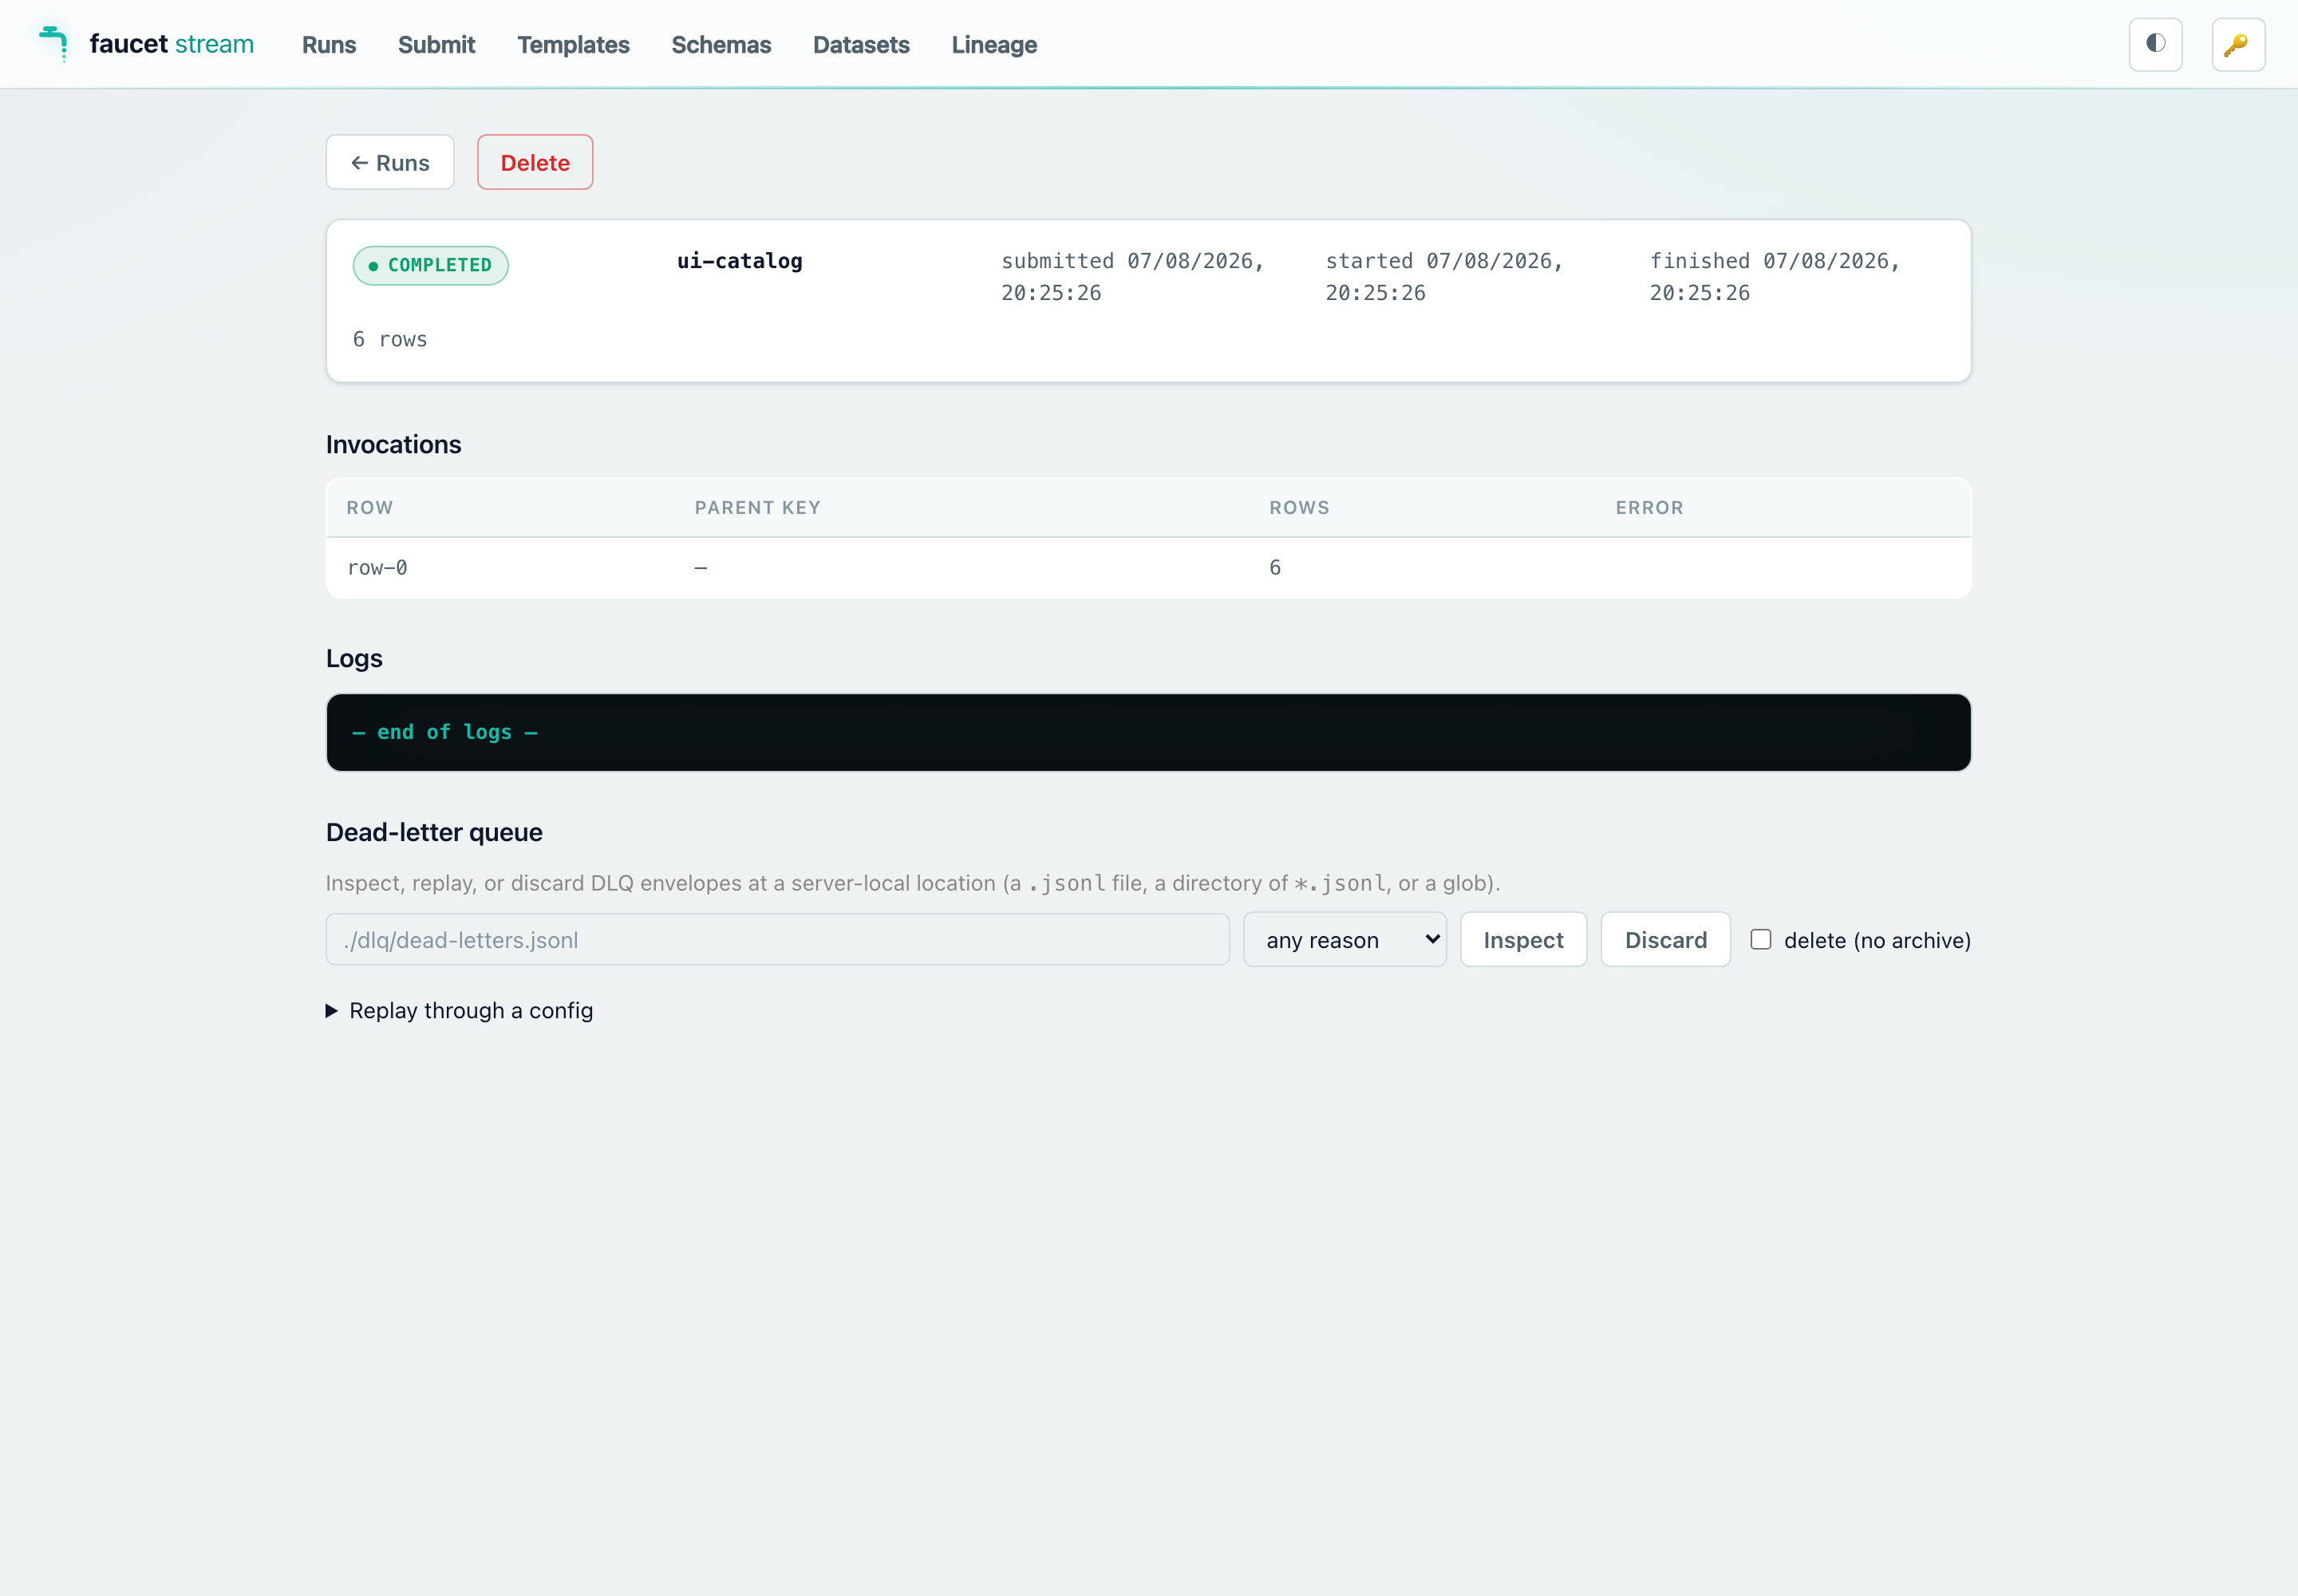
Shows the full run record (status, timestamps, labels, config) plus every
invocation in the matrix. For in-flight runs it streams structured log events
live via SSE (the same GET /v1/runs/{id}/logs endpoint). You can cancel or
delete a run from this view.
It also embeds a dead-letter-queue panel — enter a server-local DLQ location
(a .jsonl file, a directory, or a glob), then Inspect it (grouped by
reason), Discard envelopes (optionally archiving first), or Replay
through a config — paste a pipeline config and re-feed the quarantined
payloads through its transforms / quality / contract / sink, with a dry-run
toggle. This is the DLQ replay workflow, in the browser (backed by
POST /v1/dlq/{inspect,replay,discard}).
The invocations table carries each invocation’s own run id — the value of
the _faucet_run_id column and what a rollback undoes — and a finished run
made with a rollback: block gets a Roll back… button (admin-only) that
opens a panel with an invocation picker, a dry-run toggle, a force toggle for
keys a later run changed, and a config editor for servers that did not store the
run’s config. The result renders inline: what was deleted / restored, any
conflicts, and whether the bookmark was rewound (backed by
POST /v1/runs/{id}/rollback; see Undoing a run).
Submit
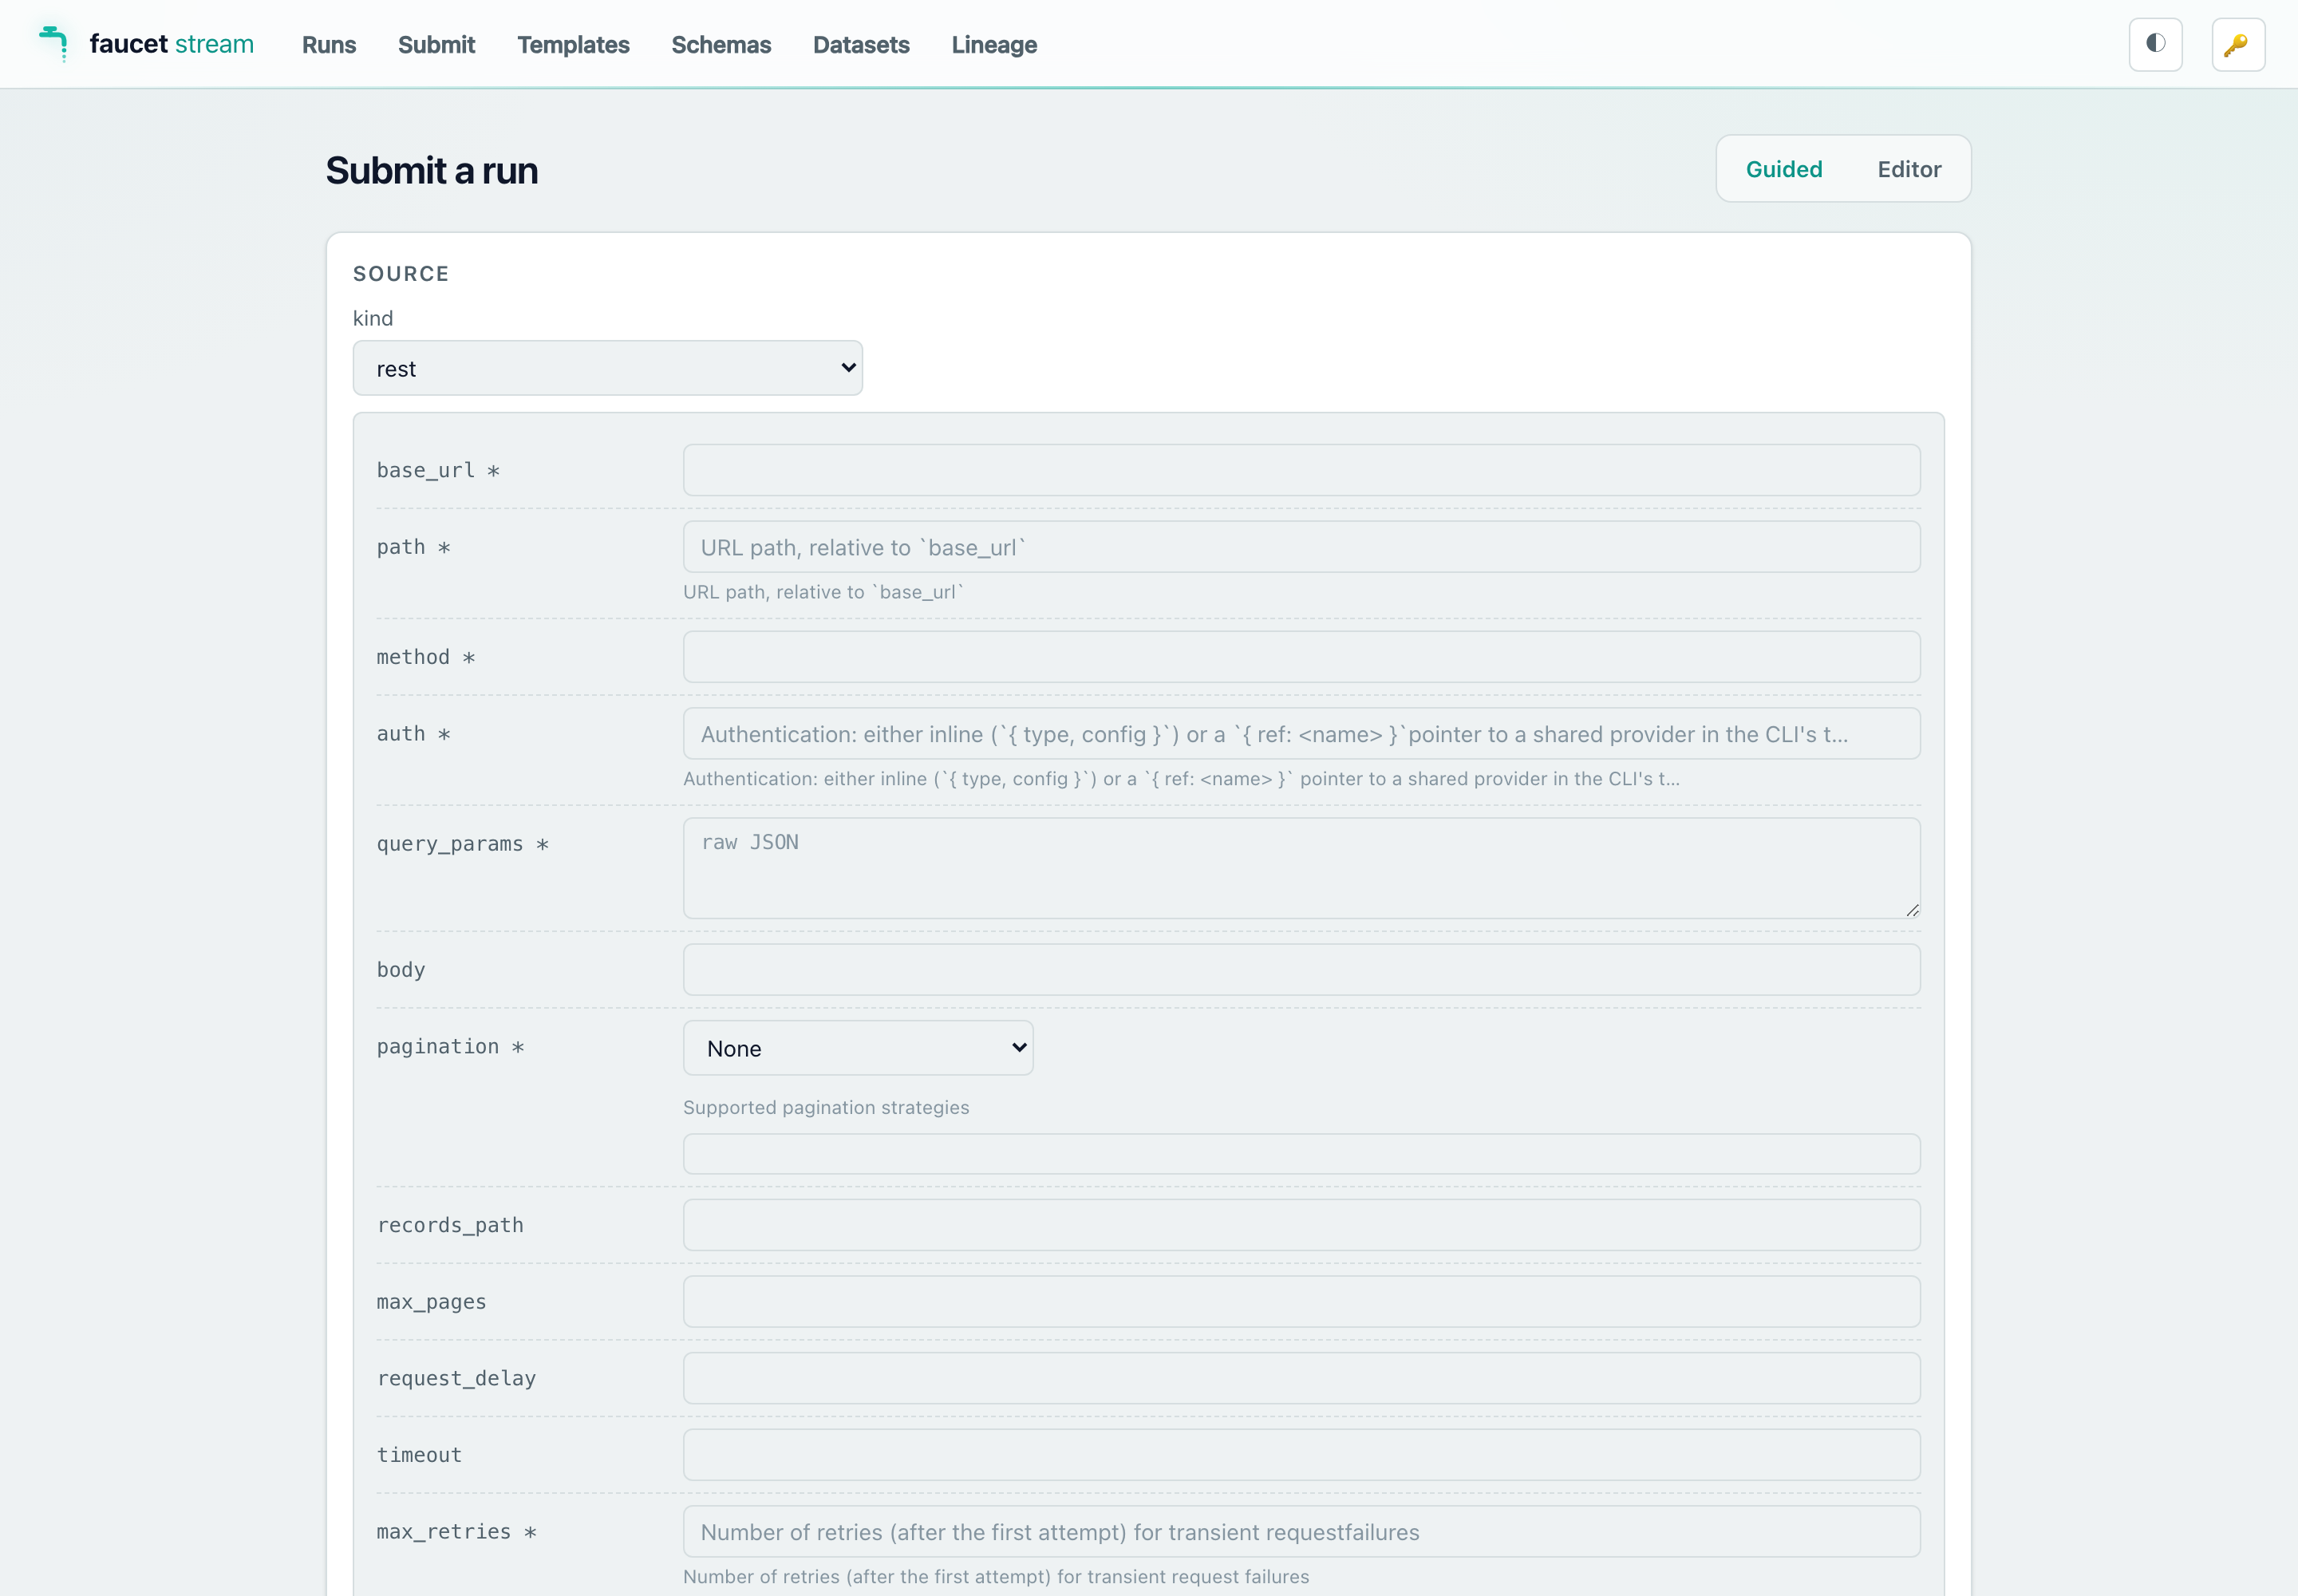
Two modes for submitting a new pipeline run:
- Raw editor — paste or type YAML/JSON directly into a text area. The same
format accepted by
POST /v1/runs. - Schema wizard — select a source and sink from the compiled connector list,
fill in the generated form fields, and the wizard assembles a valid config.
The form is derived from the same JSON Schemas returned by
GET /v1/schemas/{kind}/{name}. Below the transforms, two optional sections add the rest of a pipeline: Reliability (state, dead-letter queue, delivery, resilience, SLA) and Data governance (quality checks, contract, PII masking, schema drift). Each block is off until you add it; its form comes fromGET /v1/schemas/block/{name}.
Schemas explorer
Browses the connector catalog compiled into the running server
(GET /v1/schemas). Click any source, sink, or transform to view its full
JSON Schema — useful for checking config field names and types without leaving
the browser.
Templates
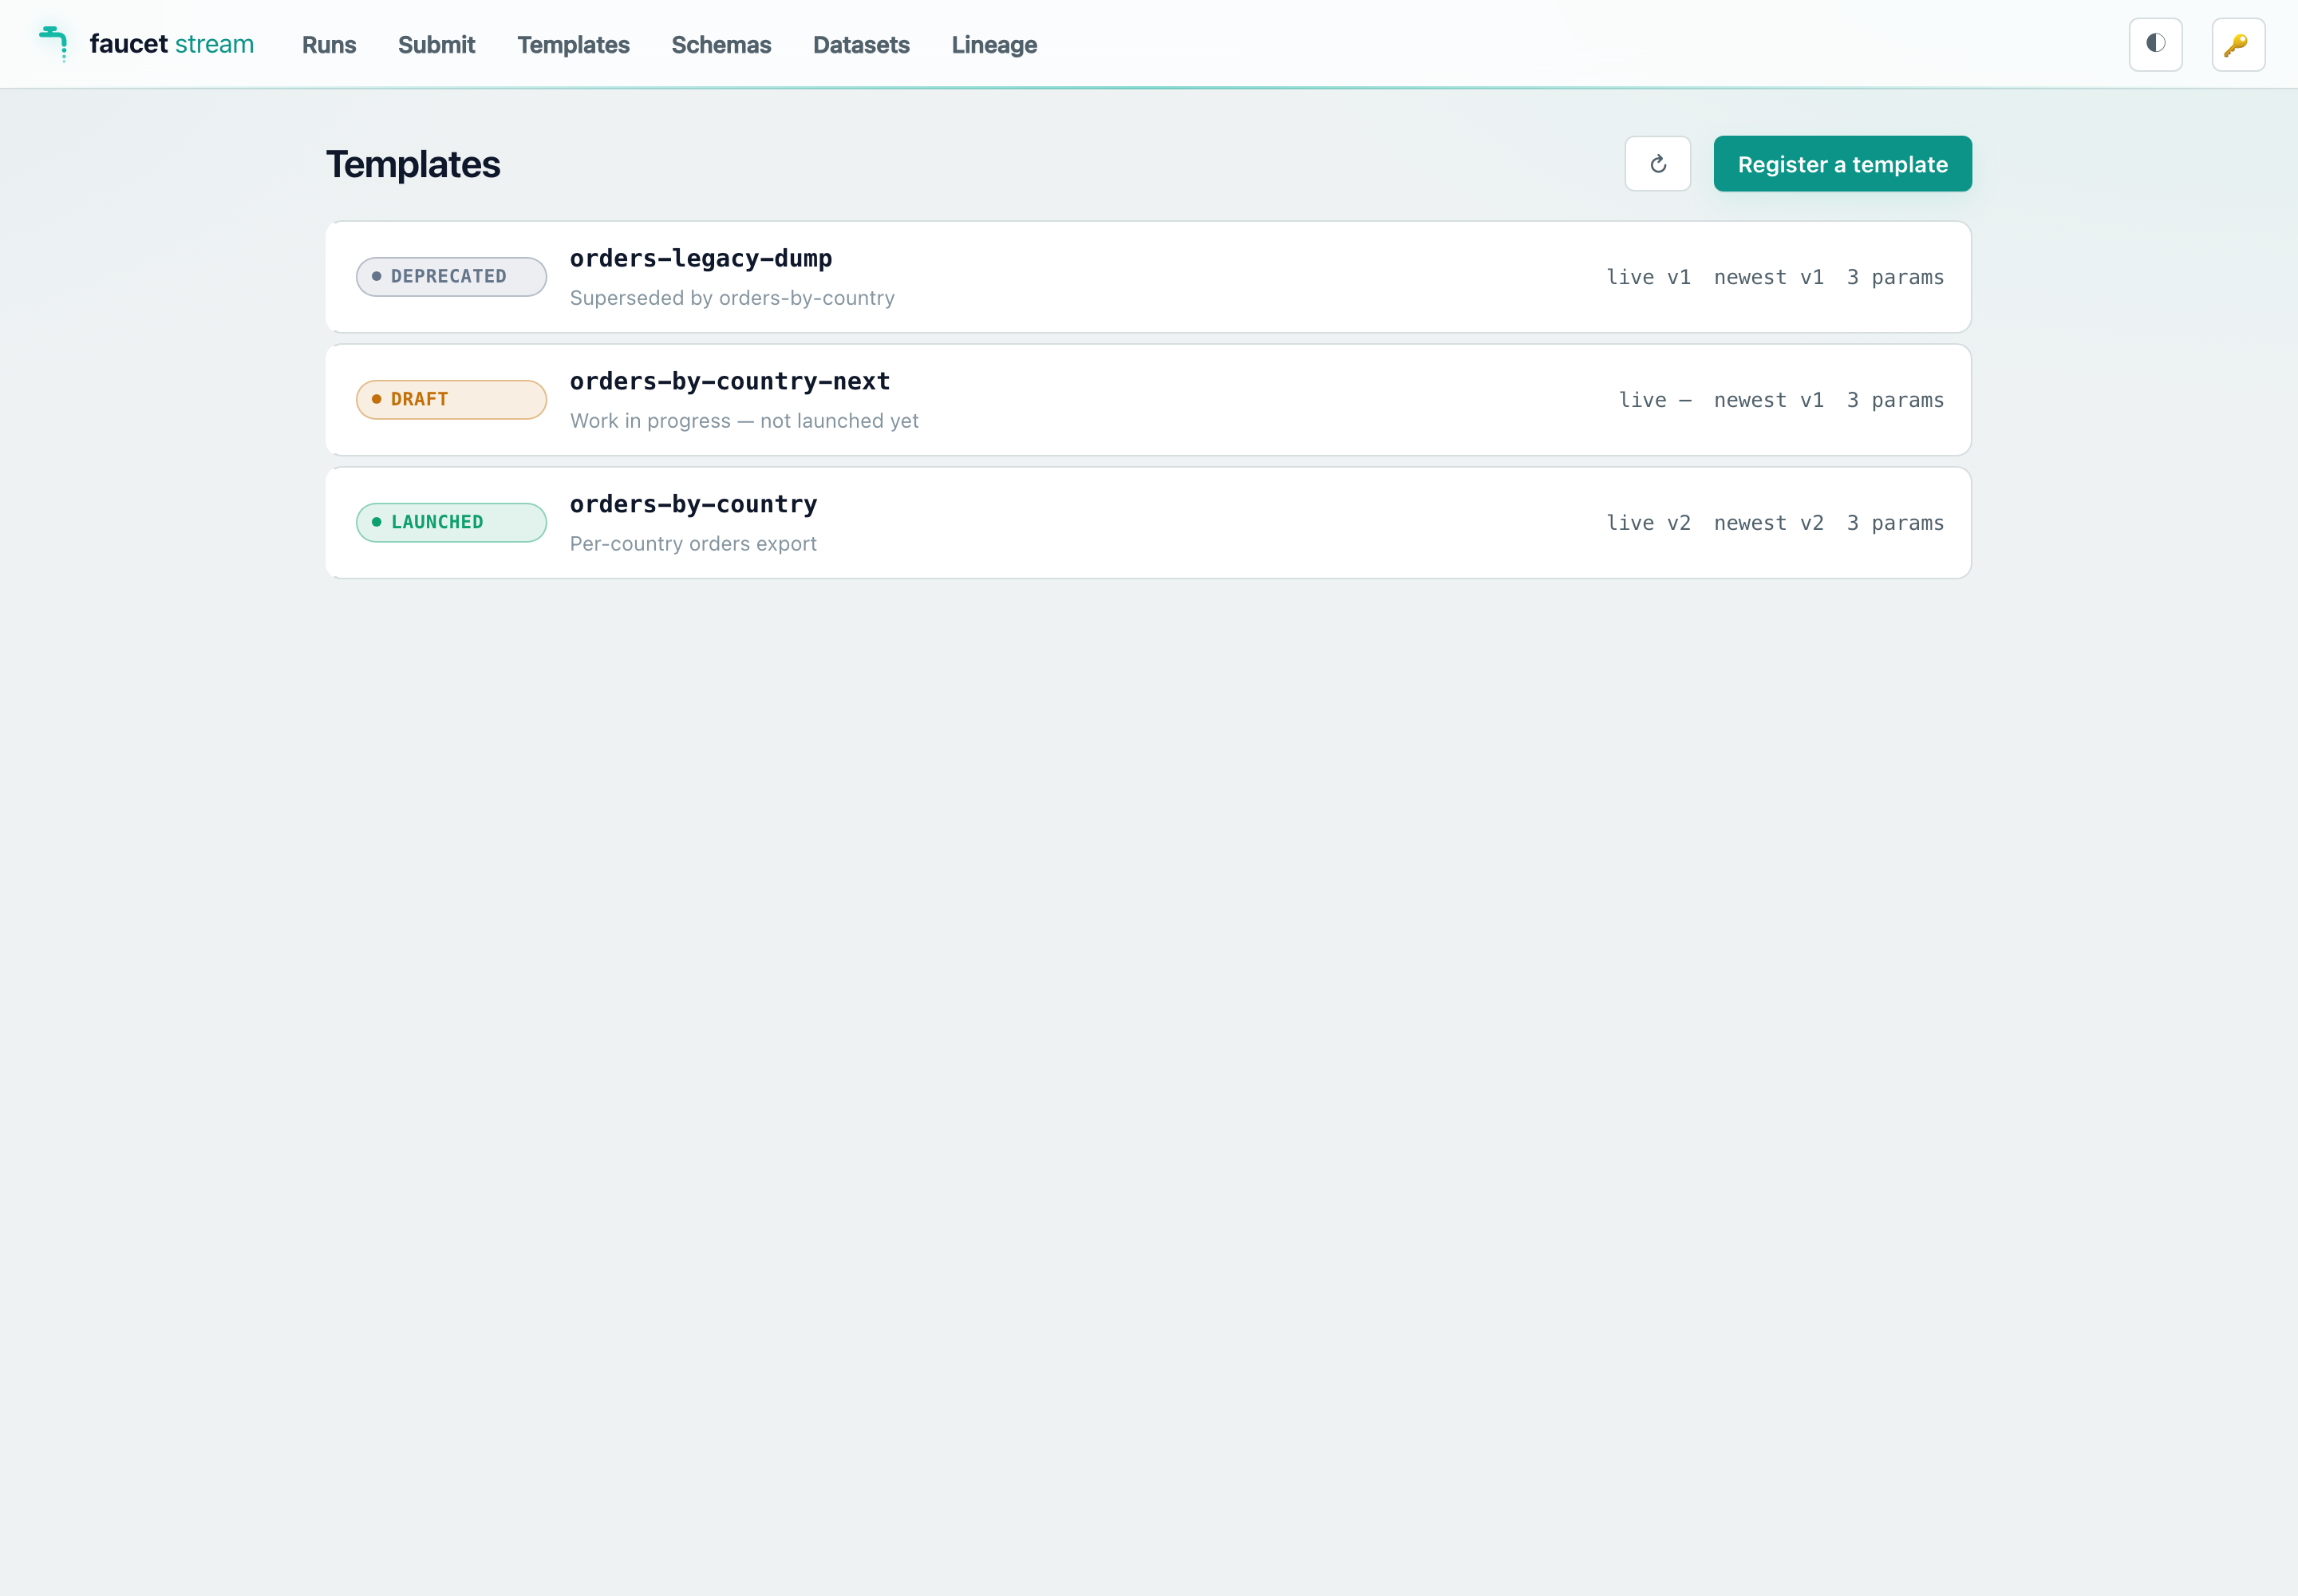
When the server is built with the templates feature, a Templates view browses
the template registry in the --history backend. Every row
carries a kind pill — source (a system and its streams), sink (a
destination), deployment (the operational blocks — state, DLQ, notifications,
SLA — applied over a composed run), or pipeline (a complete config) — beside its lifecycle status
(draft / launched / deprecated), which version is live, the build tip, and
its parameter count. Chips filter by status and by kind (deprecated templates are
hidden until their chip is toggled on). As soon as the registry holds a source
template and a sink template, a Compatibility grid sits above the list —
one row per source, one column per sink, ✓ where every stream has a write mode
the sink supports (the tooltip lists the per-stream plan); clicking a cell opens
the source’s page with that sink preselected in its trigger form:
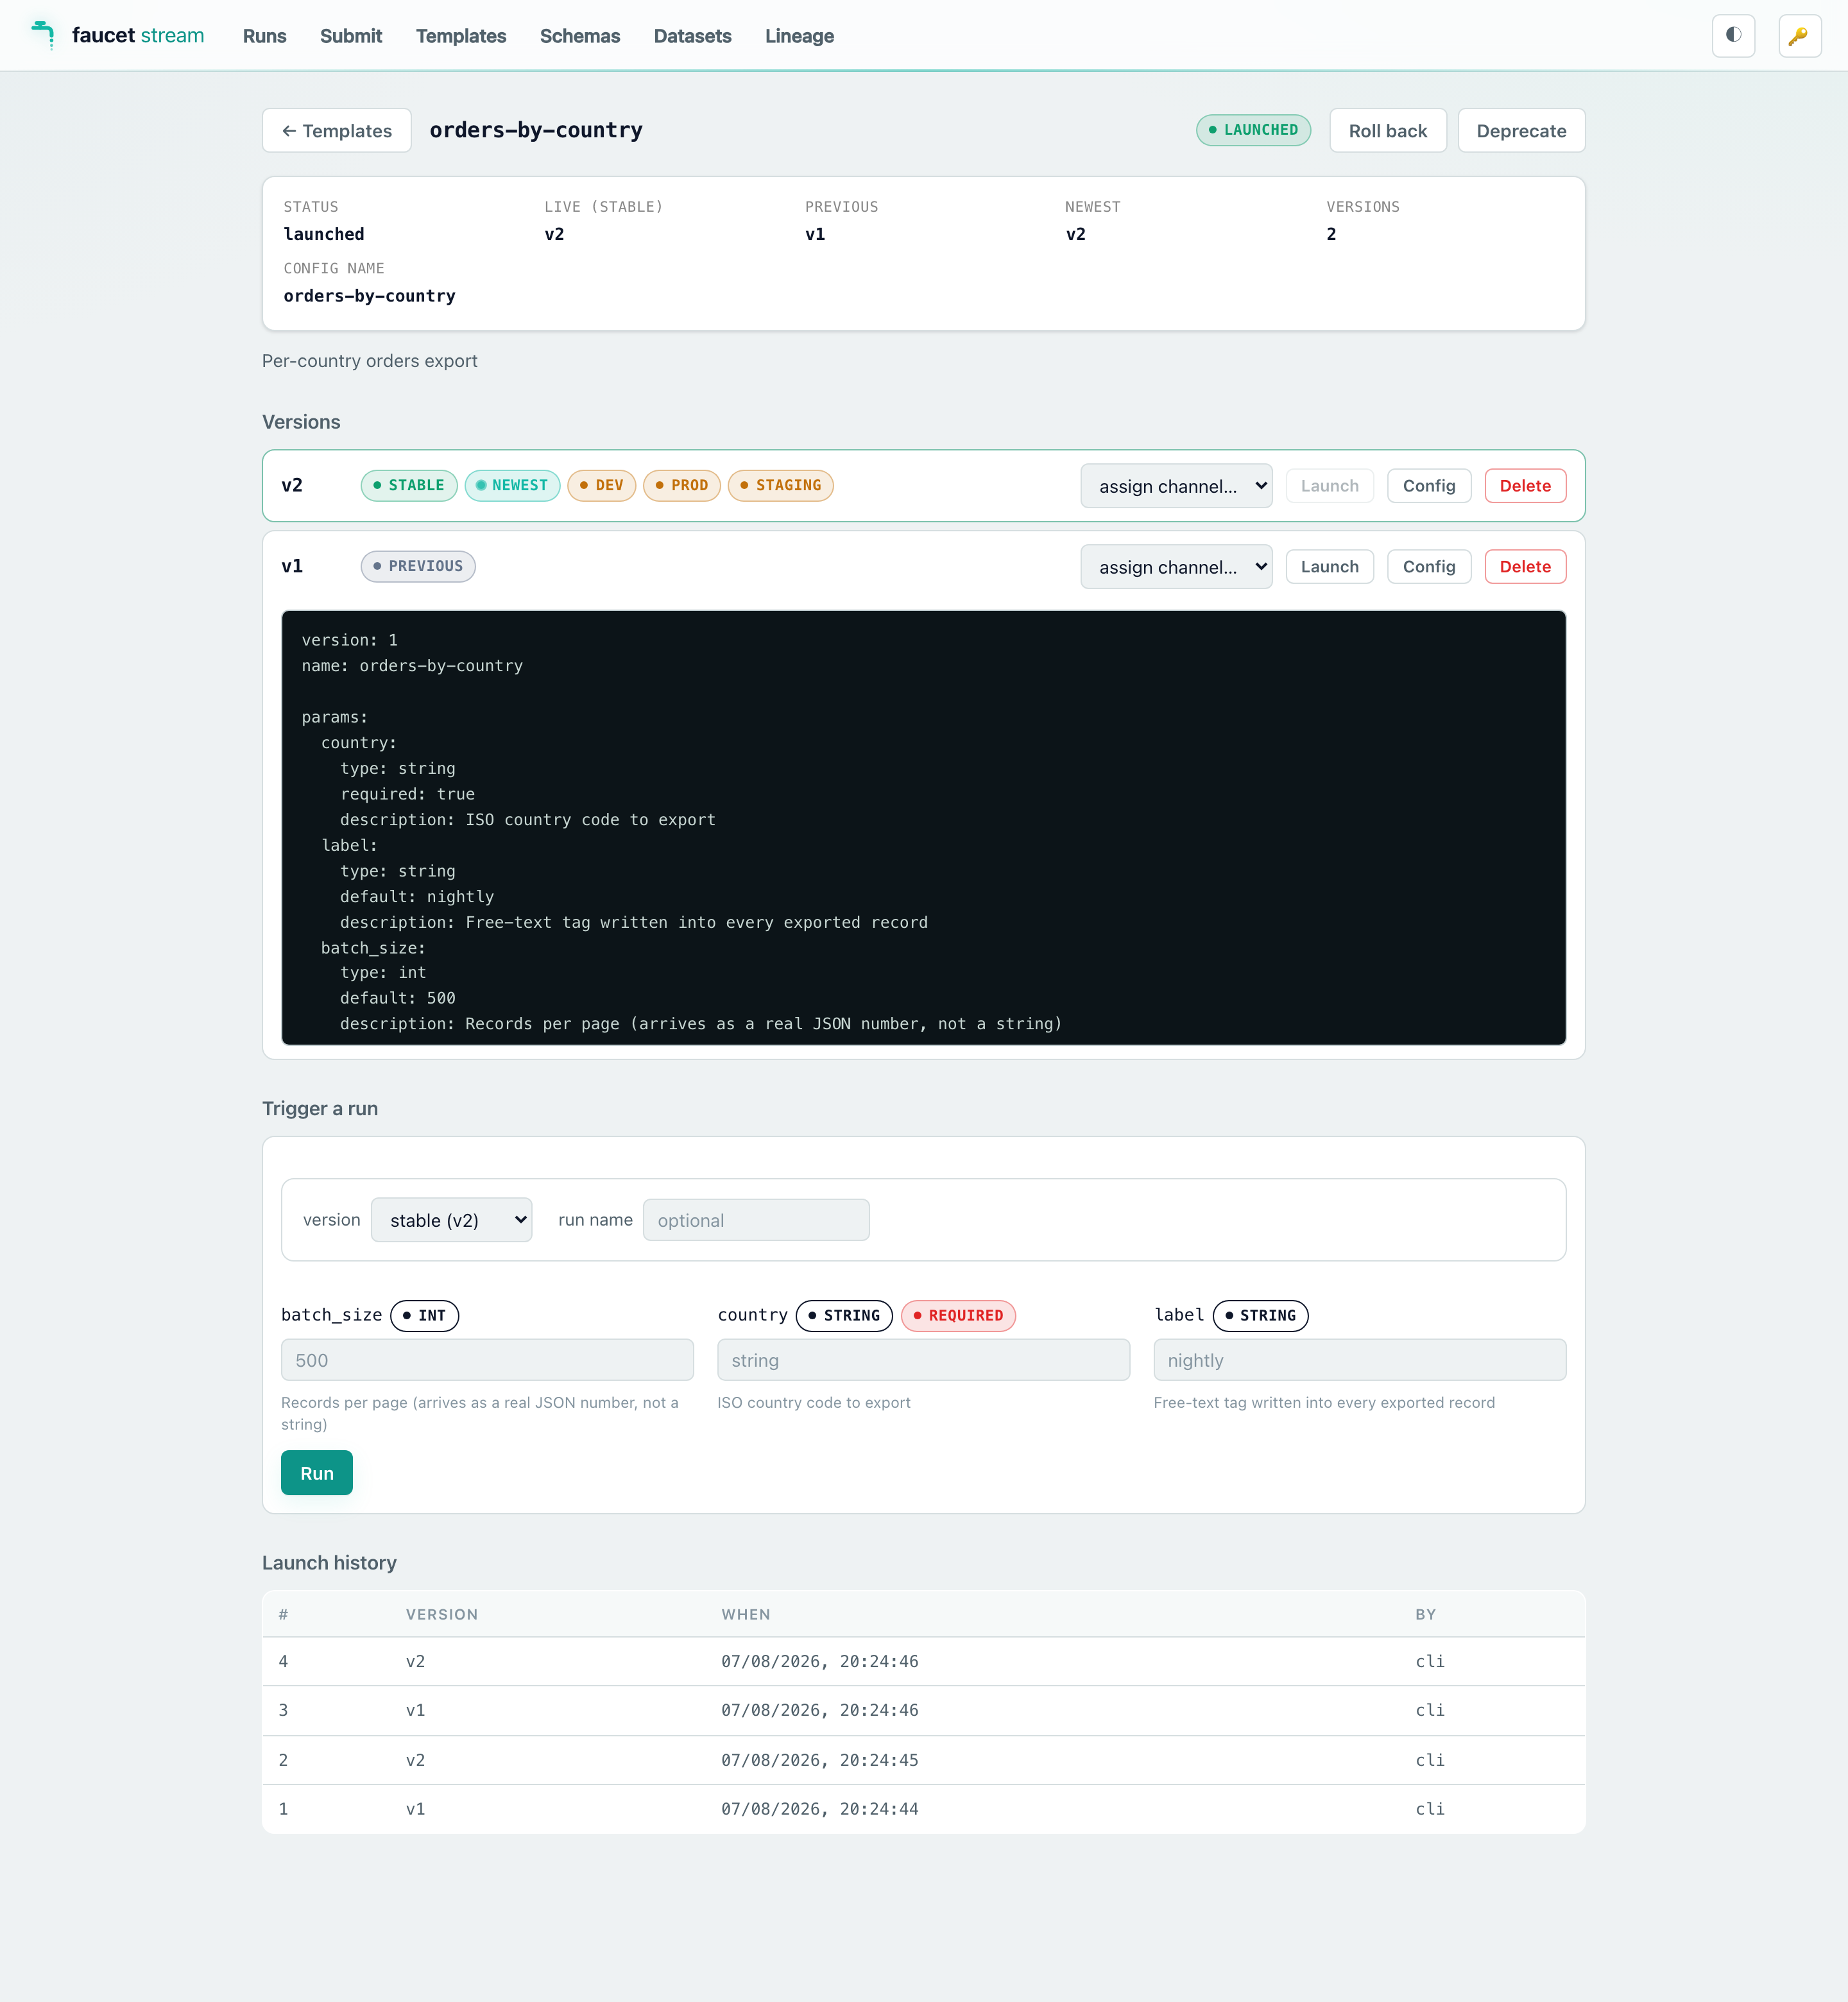
Clicking one opens its versions page — the release console for that template:
- one row per stored version, with the channels currently pointing at it
(
stable/previous/newestderived,dev…prodassigned) and an assign-channel dropdown - Launch on any version (disabled on the live one), Roll back to the previous launch, and Deprecate / Revive
- Config to expand the stored body verbatim, and Delete for one version
- a Trigger a run form generated from the template’s declared
params:— typed inputs, required/secret badges, descriptions — plus a version selector listing only channels that actually resolve - the launch history: who blessed which build, and when
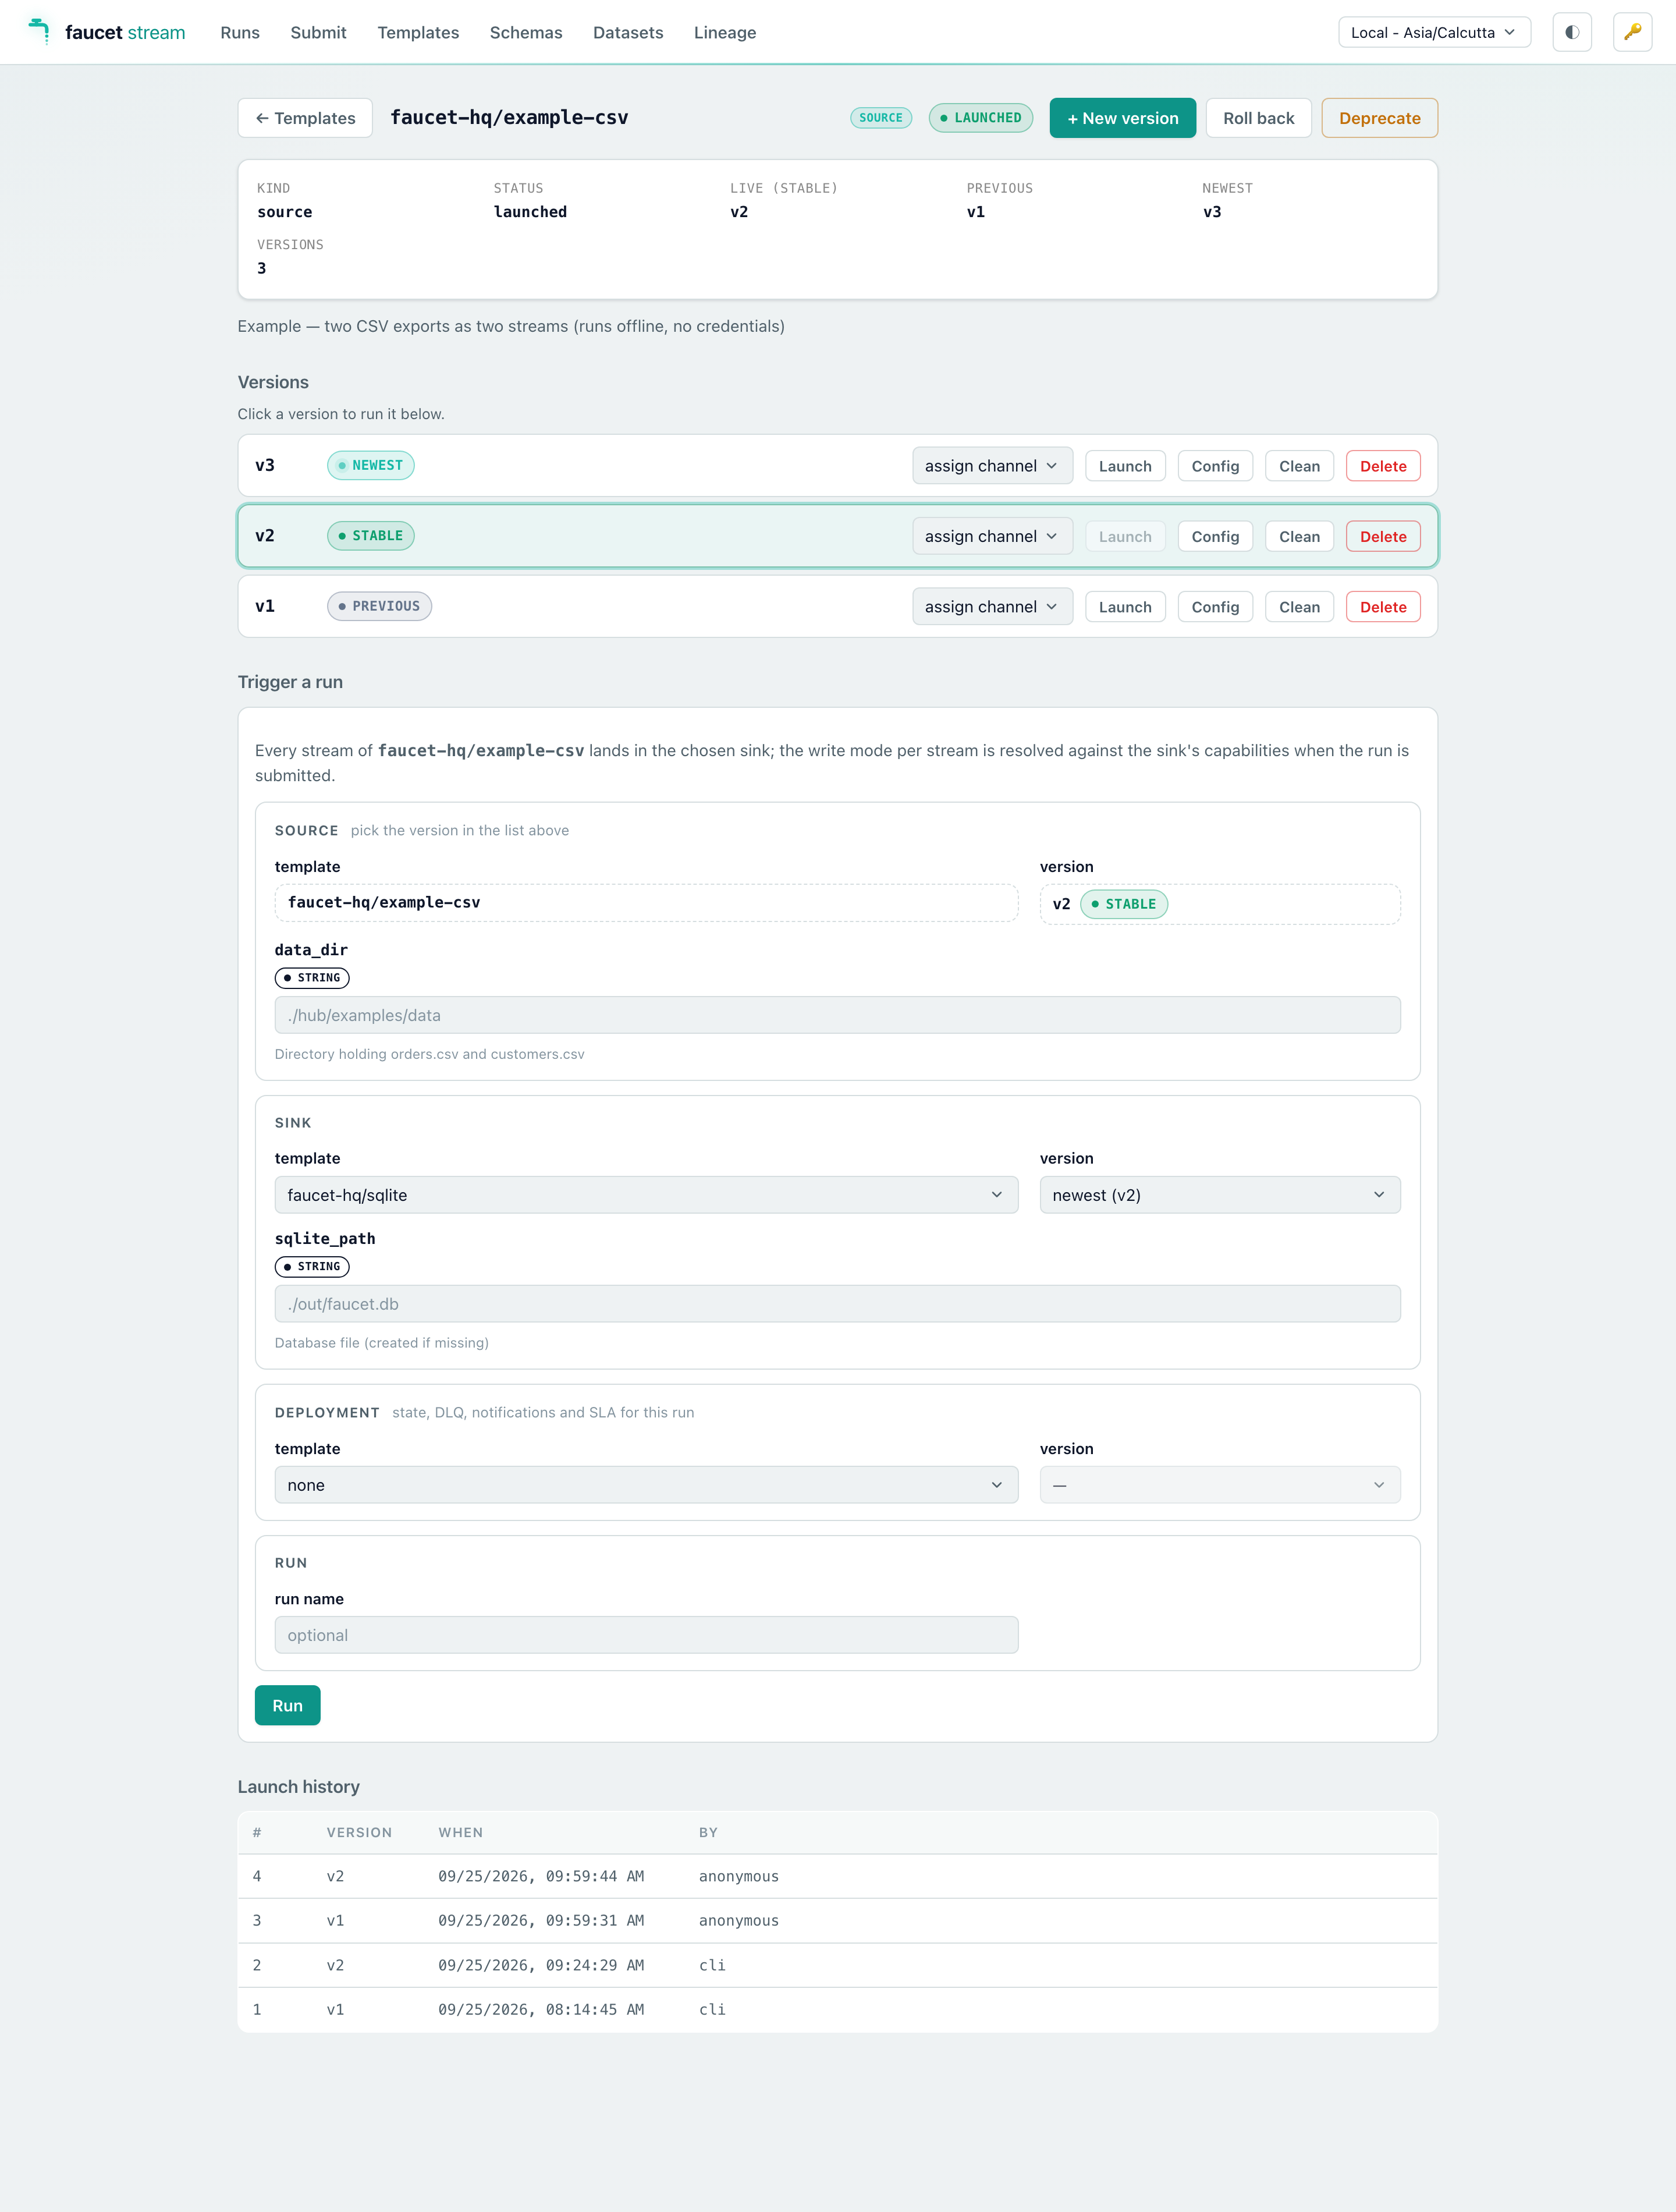
A source template’s page adds a sink template selector (plus its version
channel) to the trigger form: the chosen sink’s params join the form, tagged
sink, and the run composes the two at submit time — the same source can be
sent to BigQuery today and Postgres tomorrow from one page. A deployment
selector applies a registered deployment overlay
to the run; its params join the form tagged deployment. A sink template’s
or deployment’s page has no trigger form; it lists the source templates it
can be used with.
When the server was started with --templates-sync, the Templates page also
shows Sync from origins: the configured remote origins (repo or bucket,
prefix, launch / prune policy), a Dry run that lists exactly what a pull
would register, launch, deprecate, or skip, and Pull now to apply it — see
Hosting templates in a repo or bucket.
Registering is in the UI too — Register a template opens an editor with id /
format / description and a launch it checkbox, so a template can go from
config to live without leaving the browser.
Datasets & Lineage (Data Movement Catalog)
When the server is built with the catalog feature, two more views browse the
Data Movement Catalog accumulated in the --history backend:
-
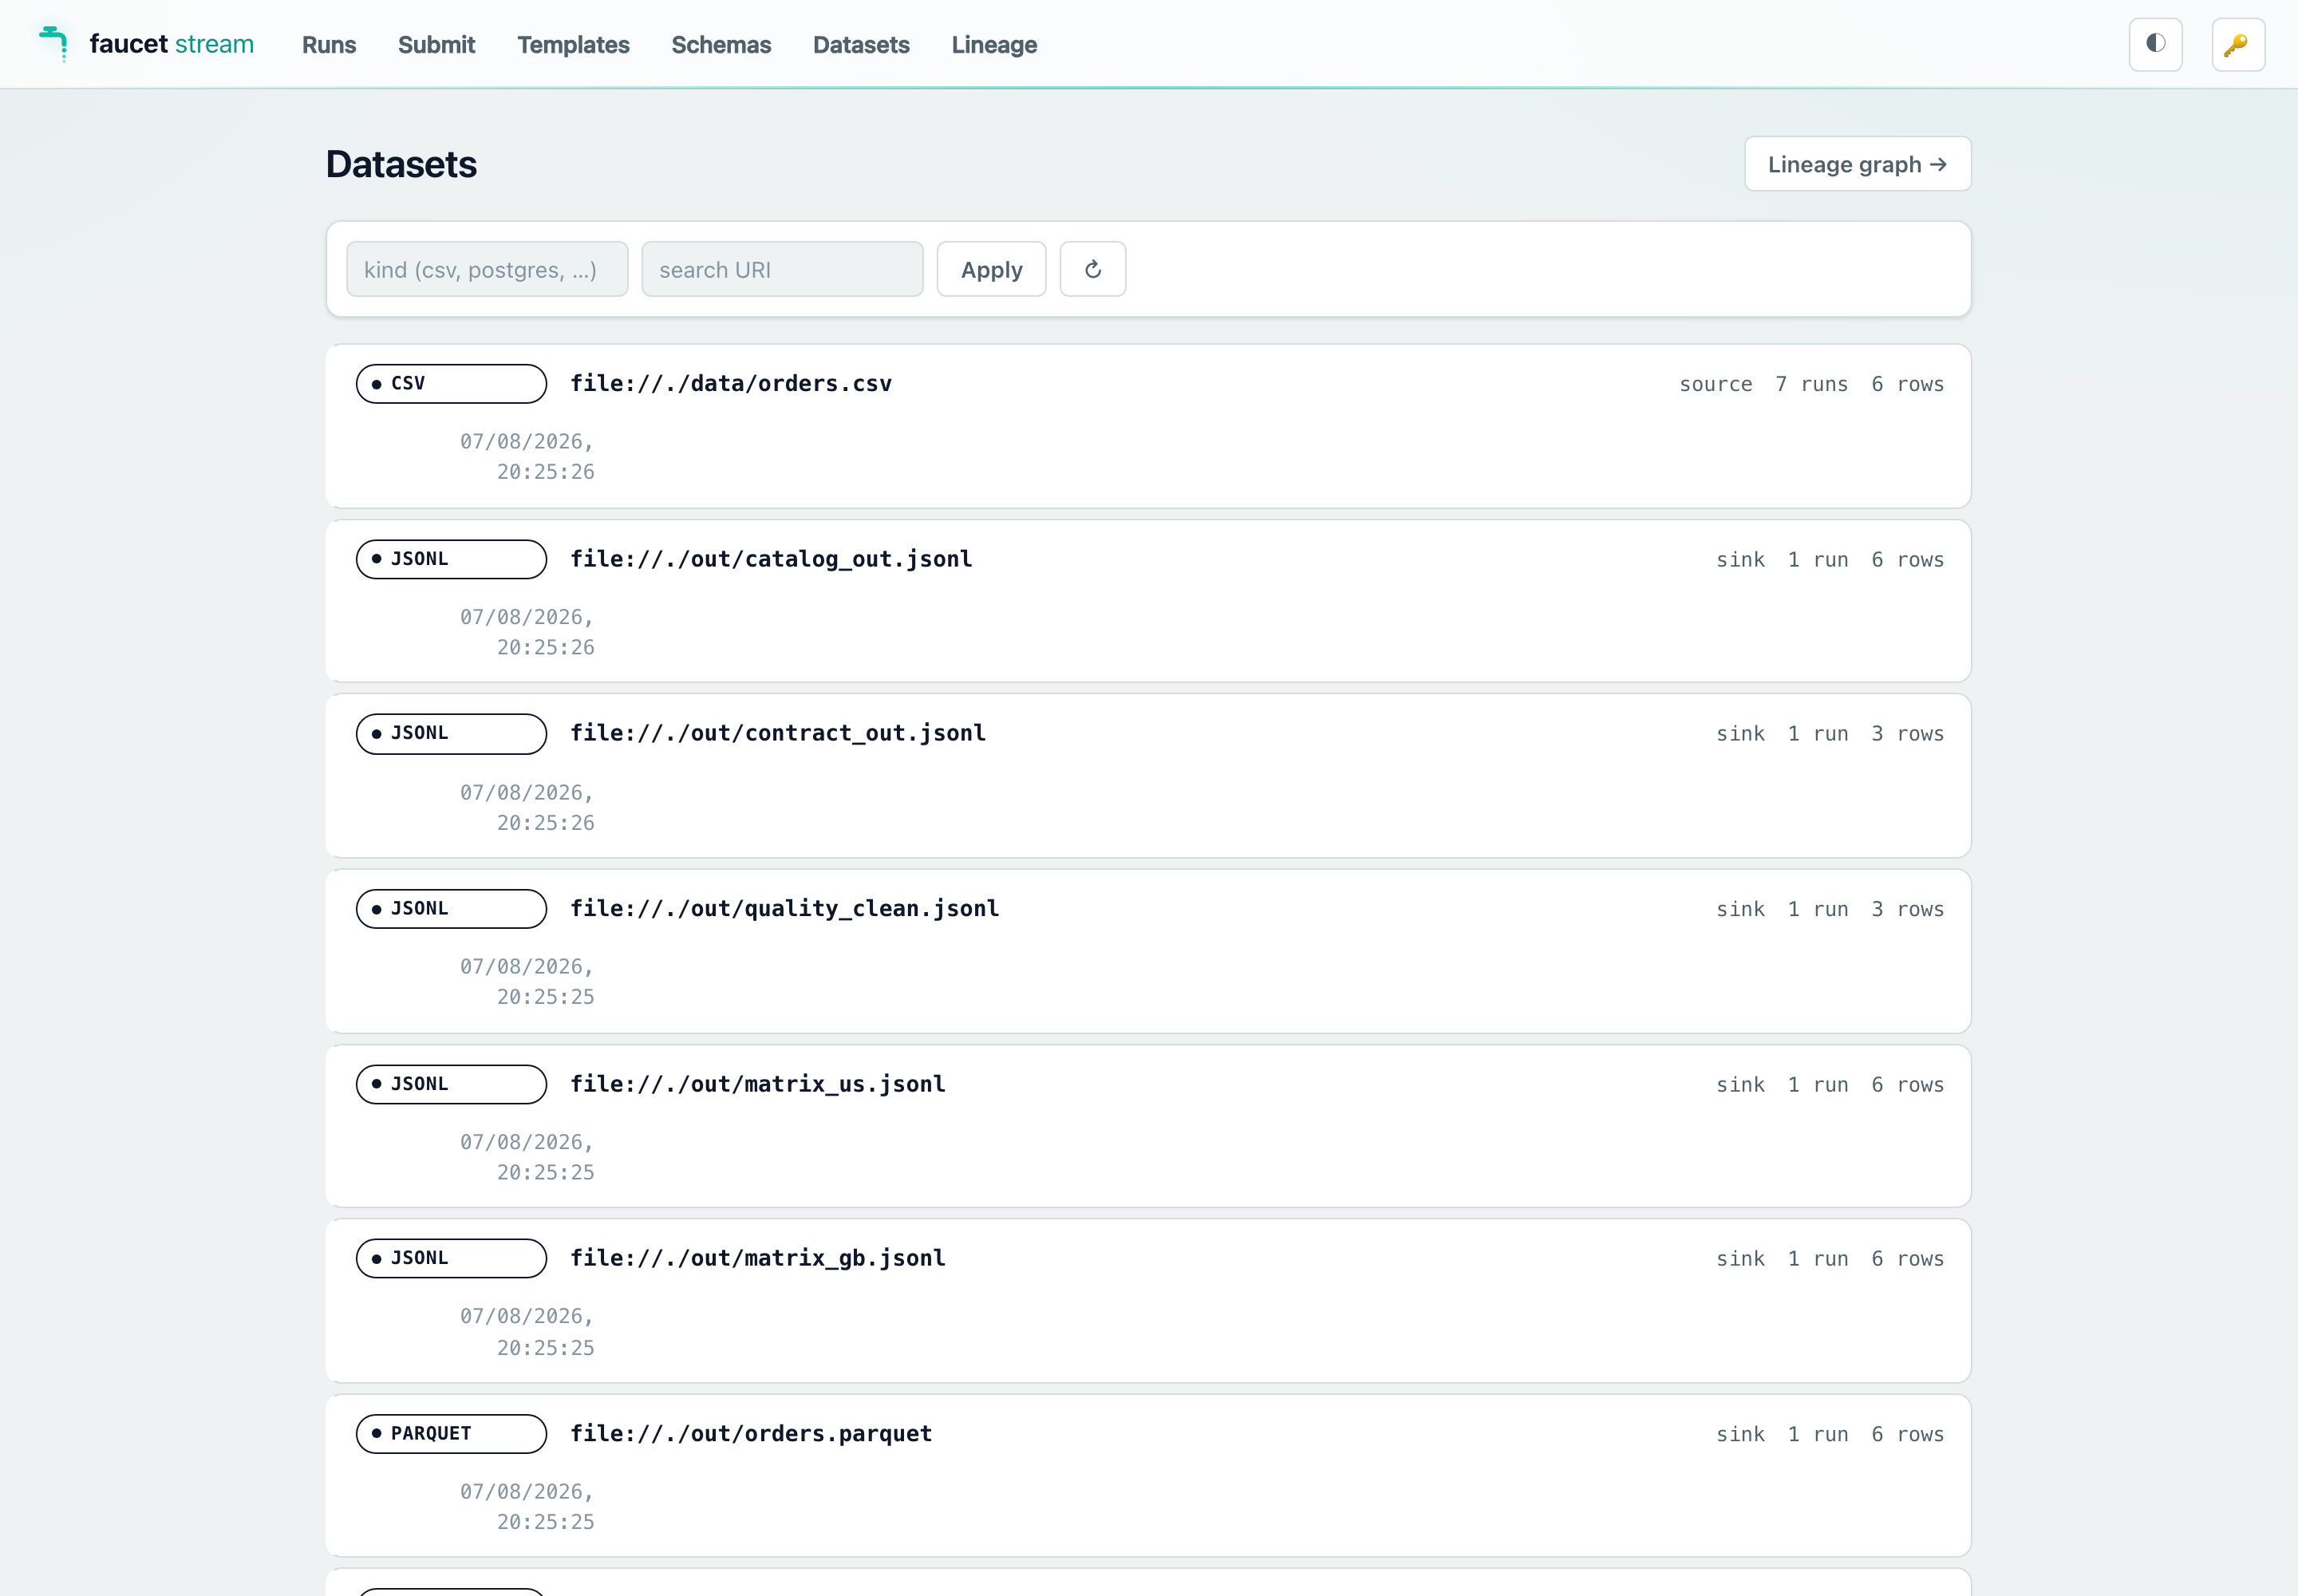
Datasets — a filterable list (kind / URI search) of every dataset the server’s pipelines have touched. Clicking a dataset opens its detail: freshness and run counters, per-run volume bars, the deduplicated schema timeline with per-version diff badges, and its upstream/downstream edges.
-
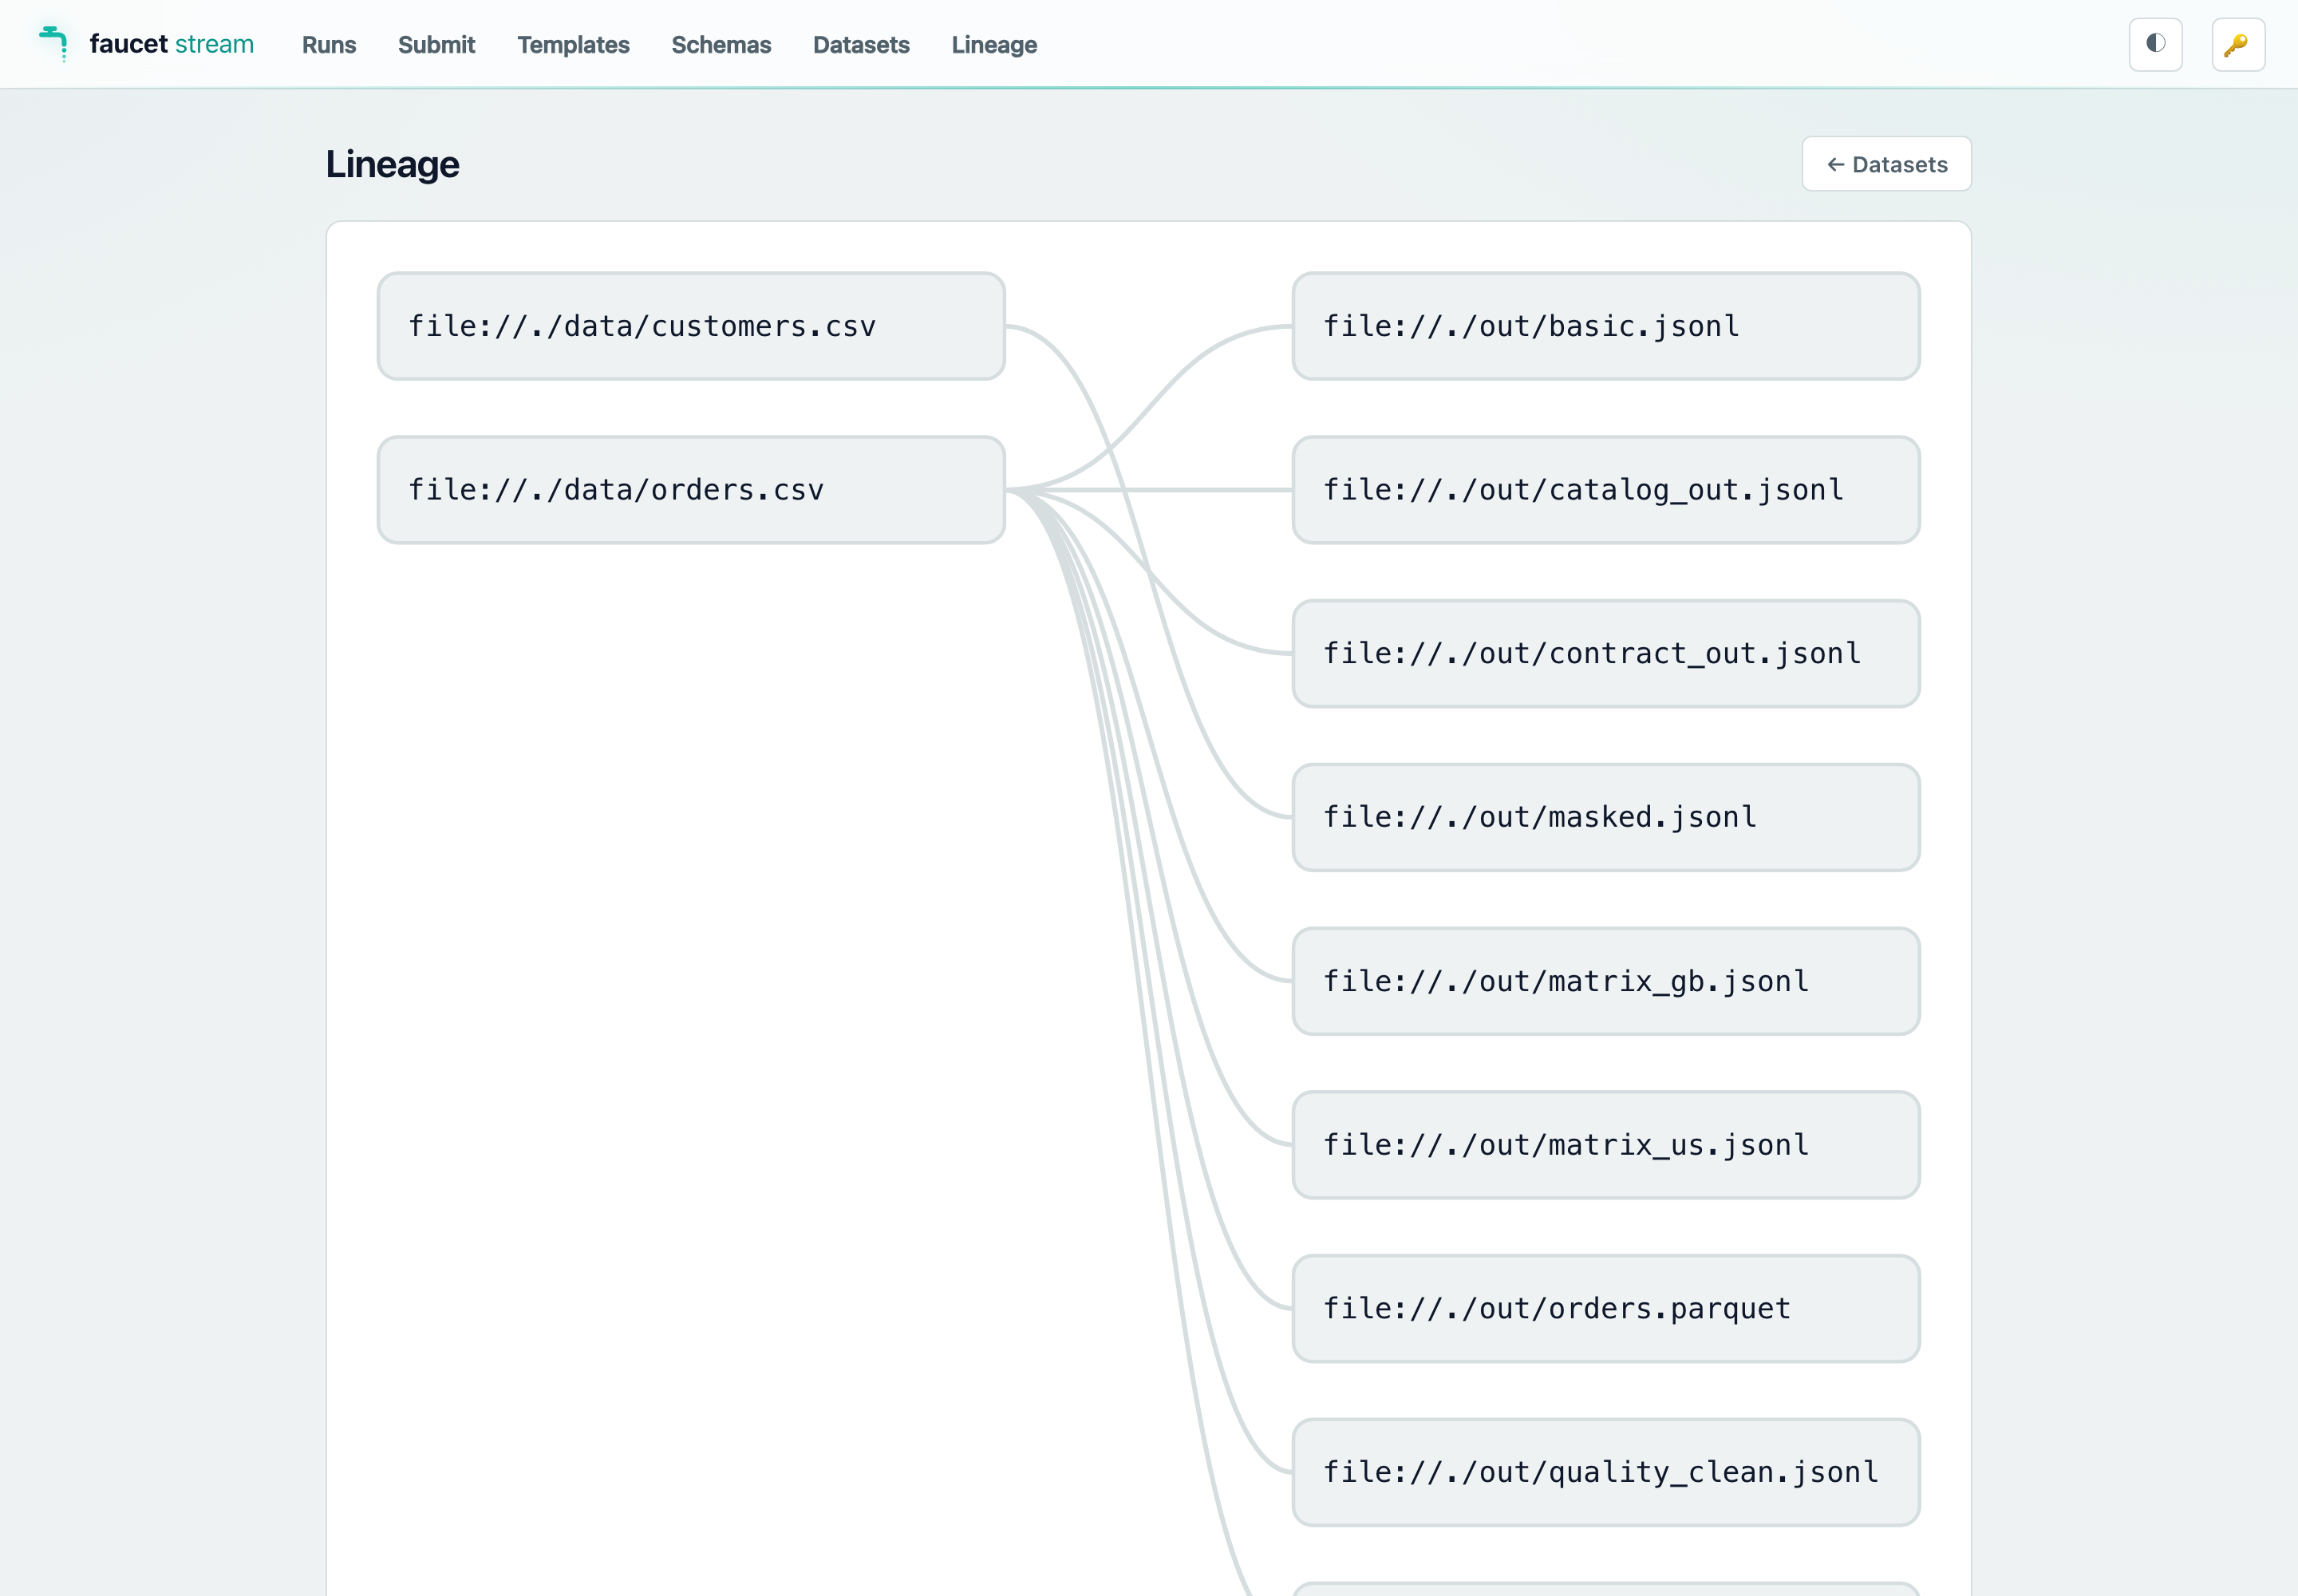
Lineage — the source→sink edge graph rendered as a layered SVG (sources left, sinks right). Hover an edge for the pipeline/run context; click a node to open its dataset detail; open a rooted, depth-bounded slice from any dataset’s detail page.
On a server built without the catalog feature both views show a short
“not available” notice (the endpoints are absent).
Cleaning up local outputs
The Datasets page is also where the local files the server’s sinks wrote (jsonl / csv / parquet) are listed and reclaimed — cleanup of data artifacts belongs next to the data artifacts, not on the Runs tab, which is about execution history. A Local outputs panel sits under the dataset list (and under each dataset’s detail, scoped to it) showing every tracked file with its age and state:
| State | Meaning |
|---|---|
present | on disk |
expired | already cleaned — the file is gone, the record is kept |
external | faucet wrote this file but did not create it (appended to it), so it is never cleaned and never previewed |
replaced | the file already existed, but faucet truncated it, so it holds only faucet’s output — previewable, still never cleaned |
Controls, when your role holds LocalOutputManage (operator and up — a
viewer sees the list and no buttons):
- Delete now on any
presentoutput. - Purge older than N days, prefilled with the server’s configured window.
- Clean all local outputs — behind a confirm, because it also removes files still inside their retention window. On a dataset’s detail page the same button is scoped to that dataset.
The model to keep in mind: data artifacts are disposable; run history is
durable. Cleaning an output removes the file — the run record is untouched,
so the Runs tab still shows what ran, and the output re-renders as expired
rather than as a broken row. Only files faucet created are ever deleted (never a
glob, never a directory); a skipped file always comes with the reason, so a “0
files” result never looks like a broken button. The same operations run
automatically on a timer — see
Local output retention.
Previewing what a run actually wrote
“12 records written” tells you the run finished. It does not tell you whether the
transform did what you meant. On a server started with
--preview-local-outputs, each tracked jsonl / csv / parquet output in the
Local outputs panel grows a Preview button: it expands inline and renders
the file’s first rows as a table, with a row-count input bounded by the server’s
own cap.
500 rows load by default; the row box takes any number up to the server’s ceiling, and All rows asks for the whole dataset:
# Local iteration loop: previews on, 500 rows by default, ceiling at 5000.
FAUCET_SERVE_AUTH_TOKEN=s3cret faucet serve --preview-local-outputs

# …and with no ceiling, so "All rows" really loads the whole file.
FAUCET_SERVE_AUTH_TOKEN=s3cret faucet serve \
  --preview-local-outputs --preview-max-rows 0
What the table shows:
- Columns are the union of the records’ fields, so a field only some records carry still gets a column — a preview never hides something that was written.
- A missing field renders
—and anullone rendersnull; they are different facts about the record. - The status line always says which it is: “whole dataset”, or “stopped at the row limit — the dataset has more”. 500 rows of a million-row file can never be mistaken for the file, and a complete read says so rather than leaving you to infer it from the absence of a warning.
- A record that is not a JSON object (a bare scalar or array per line — legal NDJSON) is rendered across the row rather than as a line of blanks.
Under the hood it is a source-backed capped read: the server reads the output back through the matching source connector and stops once it has enough rows, so previewing a huge file touches only its first pages. There is no paging — these files are sequential streams with no row index, so “show me more” is just a larger limit, which is why the panel has a row box and an All rows button instead of Next page.
On a server with a ceiling, “All rows” gives you the ceiling (the status line says it stopped at the row limit). An uncapped server gives you everything — and still stops at a 64 MiB response budget or a 30-second deadline if the dataset is larger than that, saying which. A partial answer always names the bound that produced it.
A present or replaced output gets a Preview button. An expired one has no
file left, and an external one — a file faucet appended to but did not
create — is never previewed: the part that predates faucet is not faucet’s to
serve, which is the read-side twin of the retention GC’s refusal to delete it. A
replaced file also already existed, but faucet truncated it, so every byte
in it is faucet’s output; it is previewed, and still never cleaned. Each served preview is recorded in the
audit log as local_output.preview.
It is off by default and intended for local testing — it returns file
contents over HTTP, and reading needs only LocalOutputRead (viewer and up),
so enabling it lets every viewer see the data those pipelines wrote. Without the
flag no Preview button is rendered at all (the list response says the capability
is off), and a direct API call is refused with a 403 naming the flag. A preview
of an output that retention already cleaned shows the “cleaned up — the run
record is kept” message in place of the table, never an error toast. Full detail:
Dataset preview.
Disabling the console at runtime
If you built with serve-ui but want to serve only the API (no static assets),
pass --no-ui:
FAUCET_SERVE_AUTH_TOKEN=s3cret faucet serve --no-ui
/ and /assets/* return 404; the /v1 API and the unauthenticated probes
(/healthz, /readyz, /metrics) are unaffected.
New API endpoints
The serve-ui feature ships three new bearer-gated endpoints that the console
(and any other client) can call:
| Method | Path | Description |
|---|---|---|
GET | /v1/schemas | Catalog of all compiled sources, sinks, transforms, and state-store kinds. |
GET | /v1/schemas/{kind}/{name} | JSON Schema for one connector, transform, or pipeline block (kind ∈ source/sink/transform/block). Returns 404 for unknown kind or name. |
GET | /v1/whoami | The caller’s principal, role and permissions; the console uses it to hide controls the role cannot use. |
POST | /v1/doctor | Validate and probe a submitted config without running it. Returns 200 (all probes pass) or 422 (any probe fails) with a probe report. Request body: { "config": "<yaml-or-json>", "config_format": "yaml" }. |
With the catalog feature the console also drives the local-output endpoints —
GET /v1/local-outputs, DELETE /v1/local-outputs/{id},
POST /v1/local-outputs/cleanup, and (with --preview-local-outputs)
GET /v1/local-outputs/{id}/preview — documented in the
HTTP API reference.
These endpoints require the serve feature and are available at runtime
regardless of whether --no-ui was passed.
Related pages
- Running faucet as a service — the full
faucet serveguide. - HTTP API reference — complete endpoint/schema reference.
faucet serveCLI flags — allfaucet serveflags.