Web console (serve-ui)
faucet serve optionally serves an embedded browser-based web console at /
when built with the serve-ui Cargo feature. The console gives you a visual
interface for the same HTTP API that curl or an orchestrator would use —
useful for ad-hoc runs, browsing logs, and exploring connector schemas without
leaving a browser tab.
Enabling the feature
Section titled “Enabling the feature”# Install with the embedded console (add serve-ui to your --features list)cargo install faucet-cli --features serve-ui
# Or build locallycargo build -p faucet-cli --features serve-uiserve-ui implies serve, so you do not need to list both. The full
aggregate already includes serve-ui.
Once built, start the server normally:
FAUCET_SERVE_AUTH_TOKEN=s3cret faucet serve --listen 127.0.0.1:8080Then open http://127.0.0.1:8080/ in a browser.
Token flow
Section titled “Token flow”The static shell at / is served without authentication so the browser can
load the page before it has a token. All /v1 API calls that populate the
console’s data are bearer-gated as usual.
On first load (or after a 401) the console asks for the bearer token (the same
value as FAUCET_SERVE_AUTH_TOKEN / --auth-token). The token is stored in
browser localStorage and sent as Authorization: Bearer <token> on every
subsequent /v1 request. Settings → Access token (also in the ⌘K palette)
updates or clears it.
The console then asks GET /v1/whoami who the token belongs to, shows the
principal and role at the foot of the sidebar, and hides what that role cannot
do. A viewer (shown as read-only) sees no Submit, Run, Cancel, Delete,
Launch or Deprecate controls; an operator can submit and trigger runs but
not register, launch, roll back, deprecate, assign channels to, sync or delete
templates, which is admin work. A tenant-scoped principal sees its own
tenant only, with no Tenants, Audit log, Submit or Schemas pages. Hiding a
control is only a convenience: the server refuses the action either way, and if
a token loses a role mid-session the next refused call makes the console
re-read it and redraw.
Finding your way around
Section titled “Finding your way around”The sidebar groups the pages: Operate (Overview, Runs, Changes, Triggers, Schedules, Feeds), Data (Datasets, Lineage), Build (Templates, Schemas, Submit), Govern (Policy, Usage, Tenants) and Admin (Audit log, Settings). Badges count running runs, pending change requests, datasets, templates, tenants and schedules. Feeds is marked soon: its page says what will live there and how to do it today.
- Go to… / ⌘K (Ctrl+K) opens a palette over pages, recent runs, datasets, templates, change requests, tenants and actions (submit a run, switch theme, copy a link).
- Keyboard: in any list
j/kmove,Enteropens,Escgoes back (or closes a menu),/focuses the search. - Every screen is a link. Filters, tabs and the selected item live in the URL, so Back works and the link icon in the top bar copies the page you are looking at. Every run, dataset, template and tenant name links to its page; ids, URIs and configs have a copy button; relative times show the absolute time on hover.
- The top bar holds the tenant switcher (Runs, Usage and Changes follow
it), the display time zone (every time and date input follows it), the light
/ dark switch and a button that hides the sidebar. The status line shows
the run-history backend (
sqlite,postgresormemory) and its health, cluster size and the server version. - On a server started with
--history memory, admins see a banner on every page: History is in memory: runs, audit and settings are lost on restart. Start the server without that flag to keep its history in~/.faucet/history.db(or$FAUCET_DATA_DIR), or pass asqlite:path or apostgres://URL. - Below 1100px the sidebar shrinks to icons and list pages show the selected item in place of the list, with a back link.
Overview
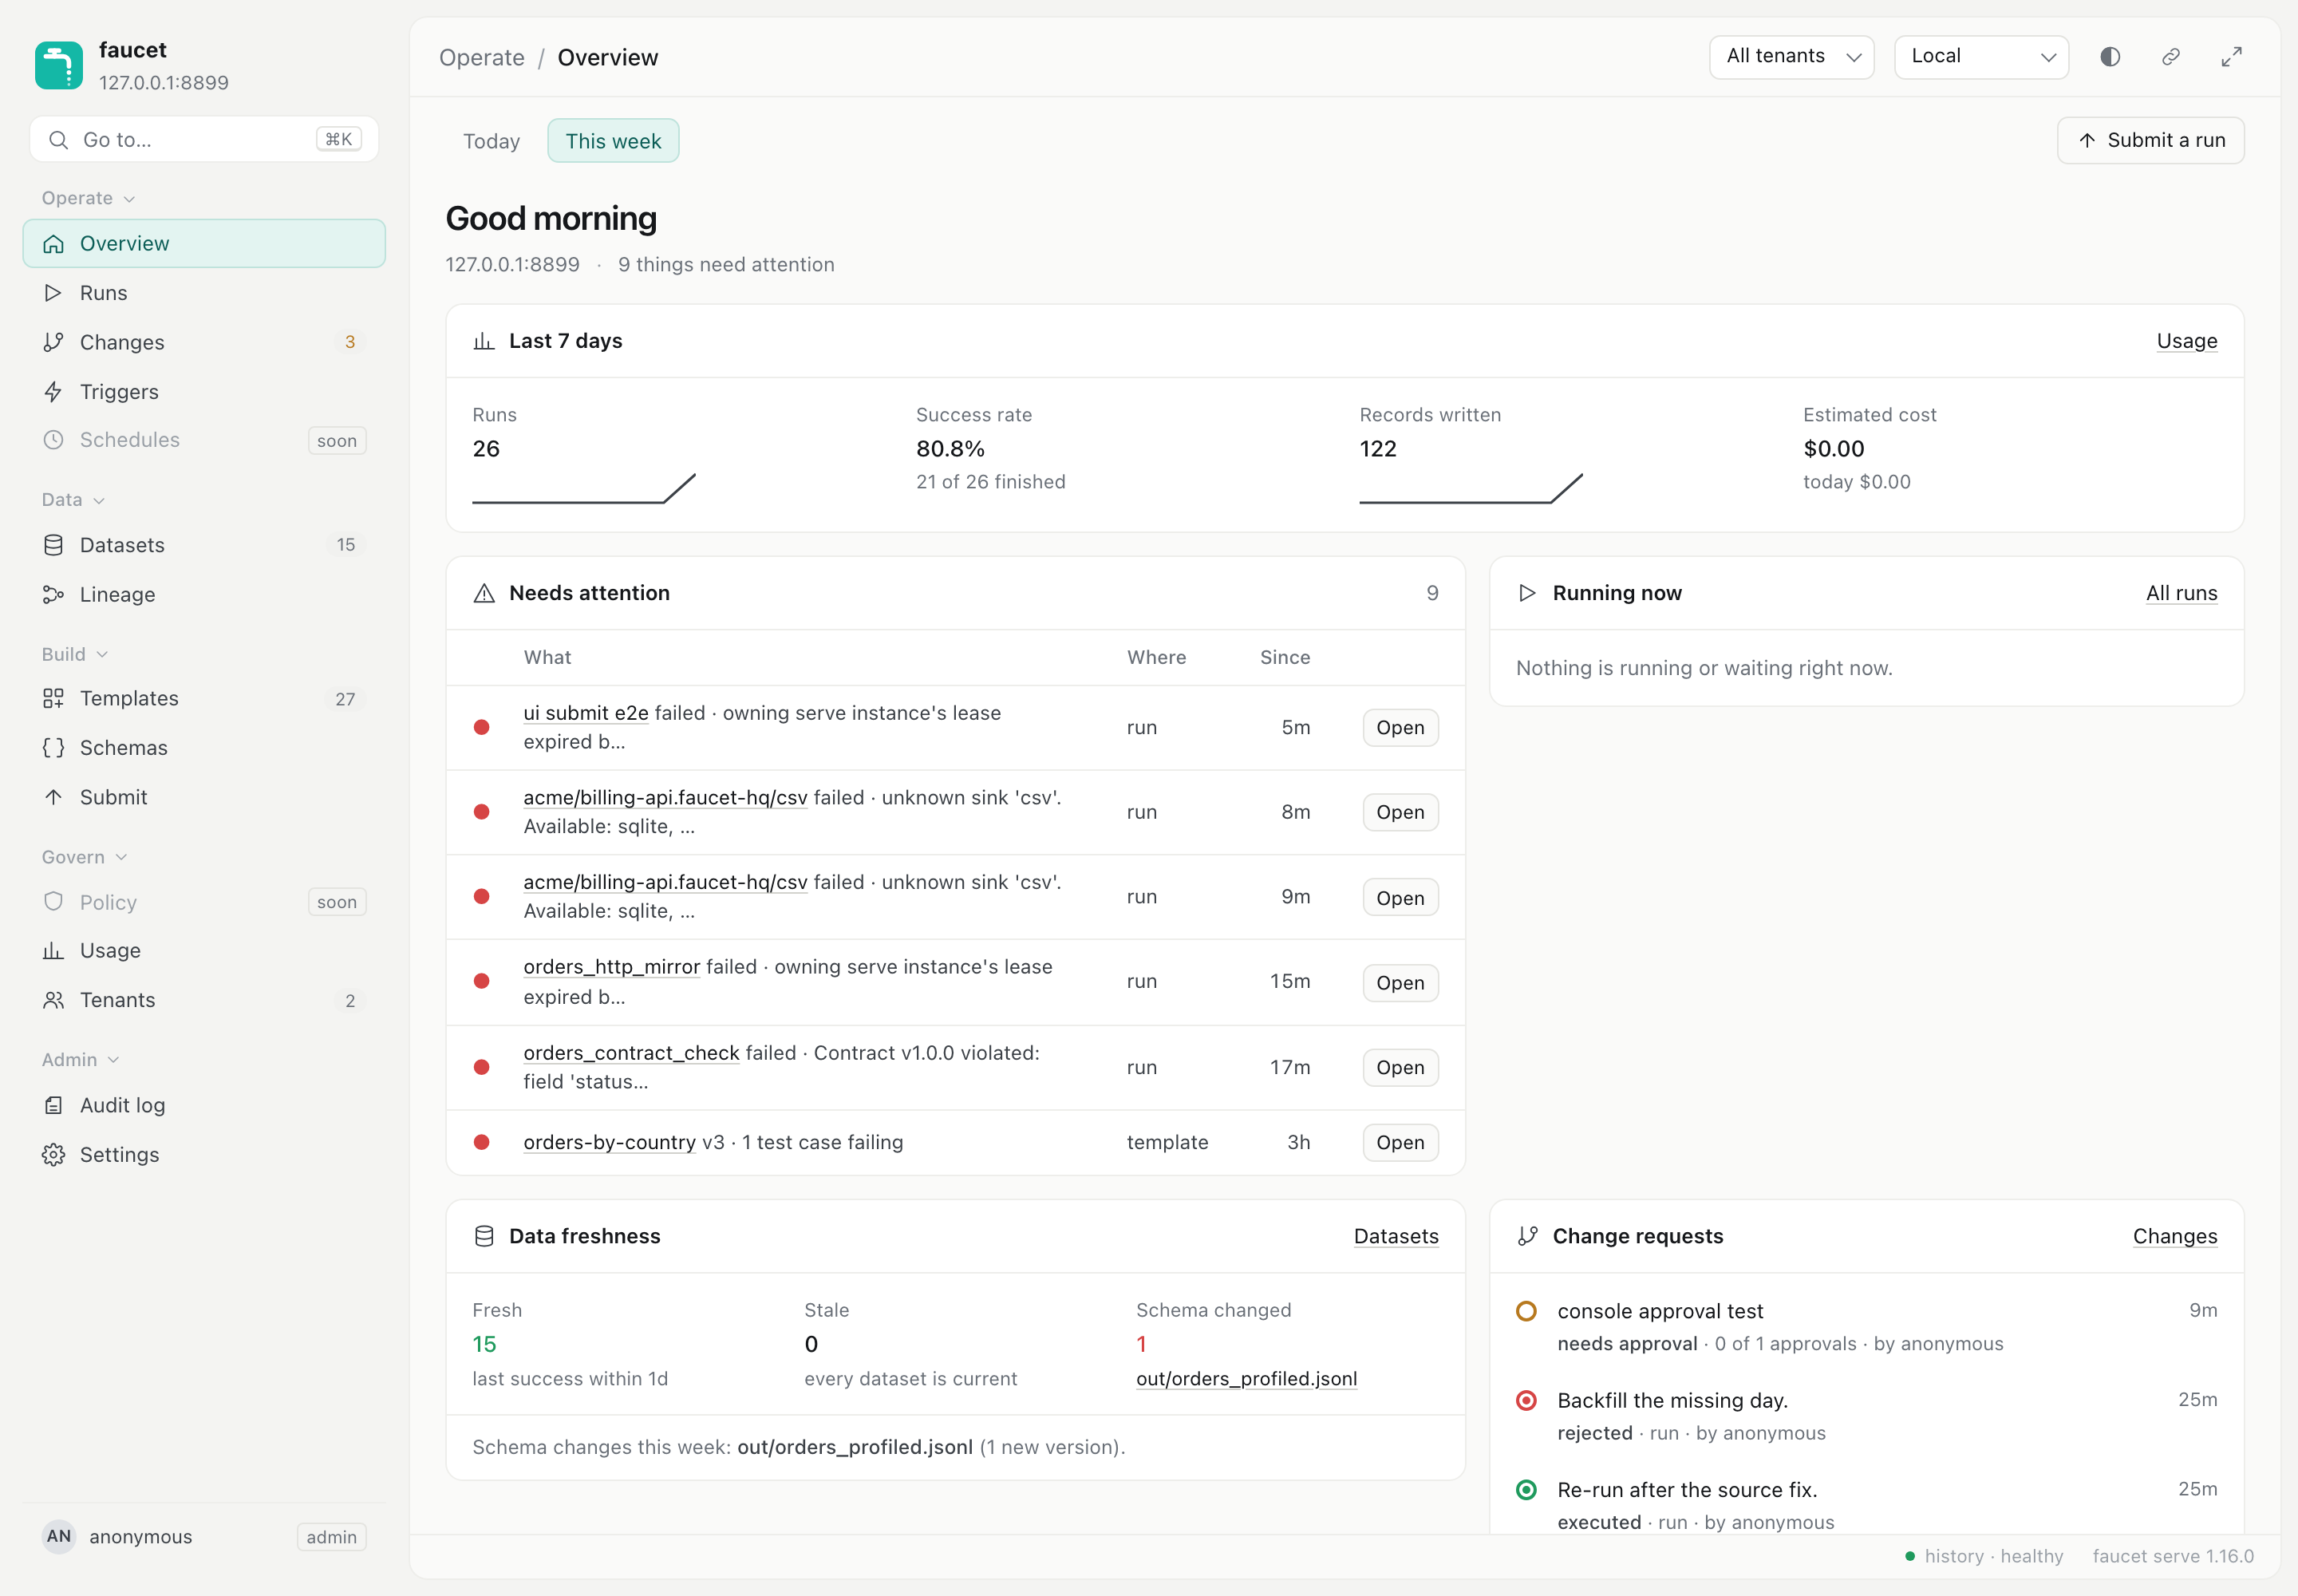
Section titled “Overview”The page the console opens on (#/overview): what needs you, what is running
now, and how the fleet did today or this week (?range=24h|7d), from the
server’s run history (GET /v1/overview), which outlives restarts and is shared
by every replica of a cluster.
- Last 24 hours / Last 7 days: runs, success rate, records written and the estimated cost, each with a trend line.
- Needs attention: failed runs, change requests waiting for approval, unhealthy triggers, templates whose newest version fails its tests and tenant connections that need re-authorization, each with an Open link.
- Running now, Data freshness (fresh, stale and schema-changed datasets) and the latest Change requests.
Runs is a split pane: the run list on the left, the selected run on the right
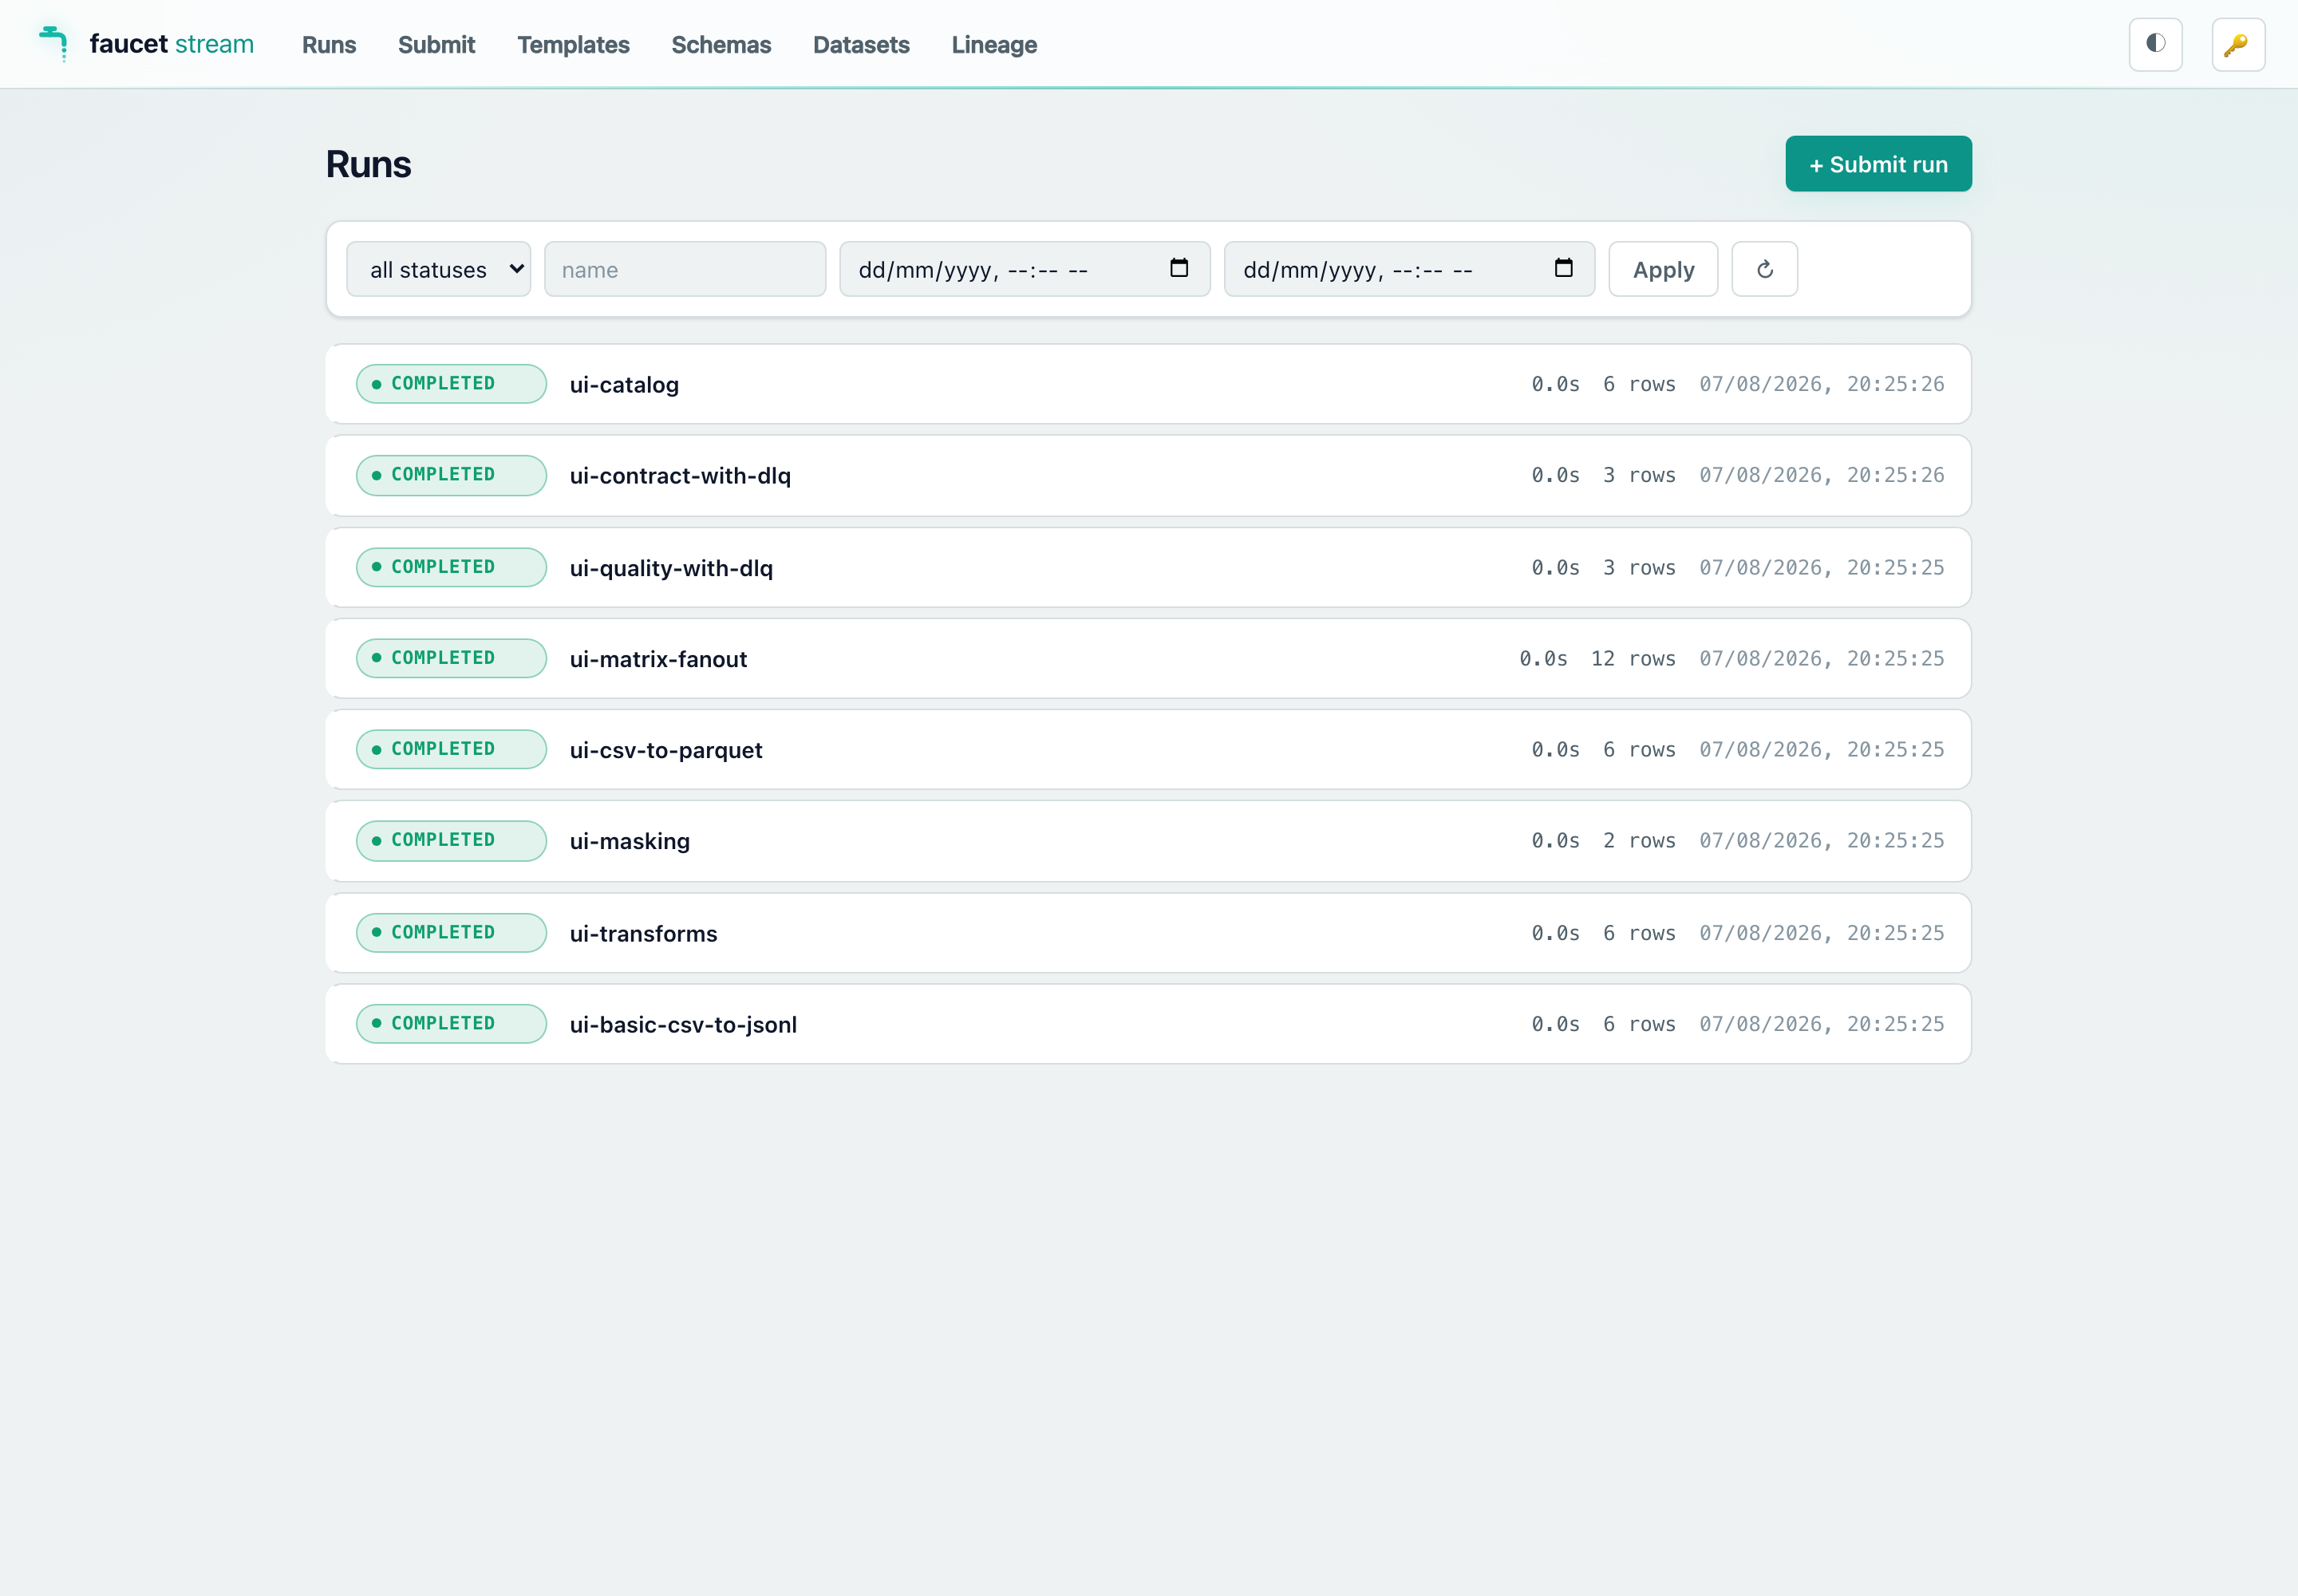
(#/runs/<id>). The list has All runs / Active / Failed tabs, a stat strip
(running, succeeded, failed, records — each a filter), a filter panel (status,
name, submitter, pool, time range, labels — all in the URL), and sections for
running, queued, failed, succeeded and cancelled runs. It refreshes every few
seconds while anything is running and keeps your scroll and selection.
With nothing selected the detail pane summarizes the last 24 hours and lists the runs that need attention.
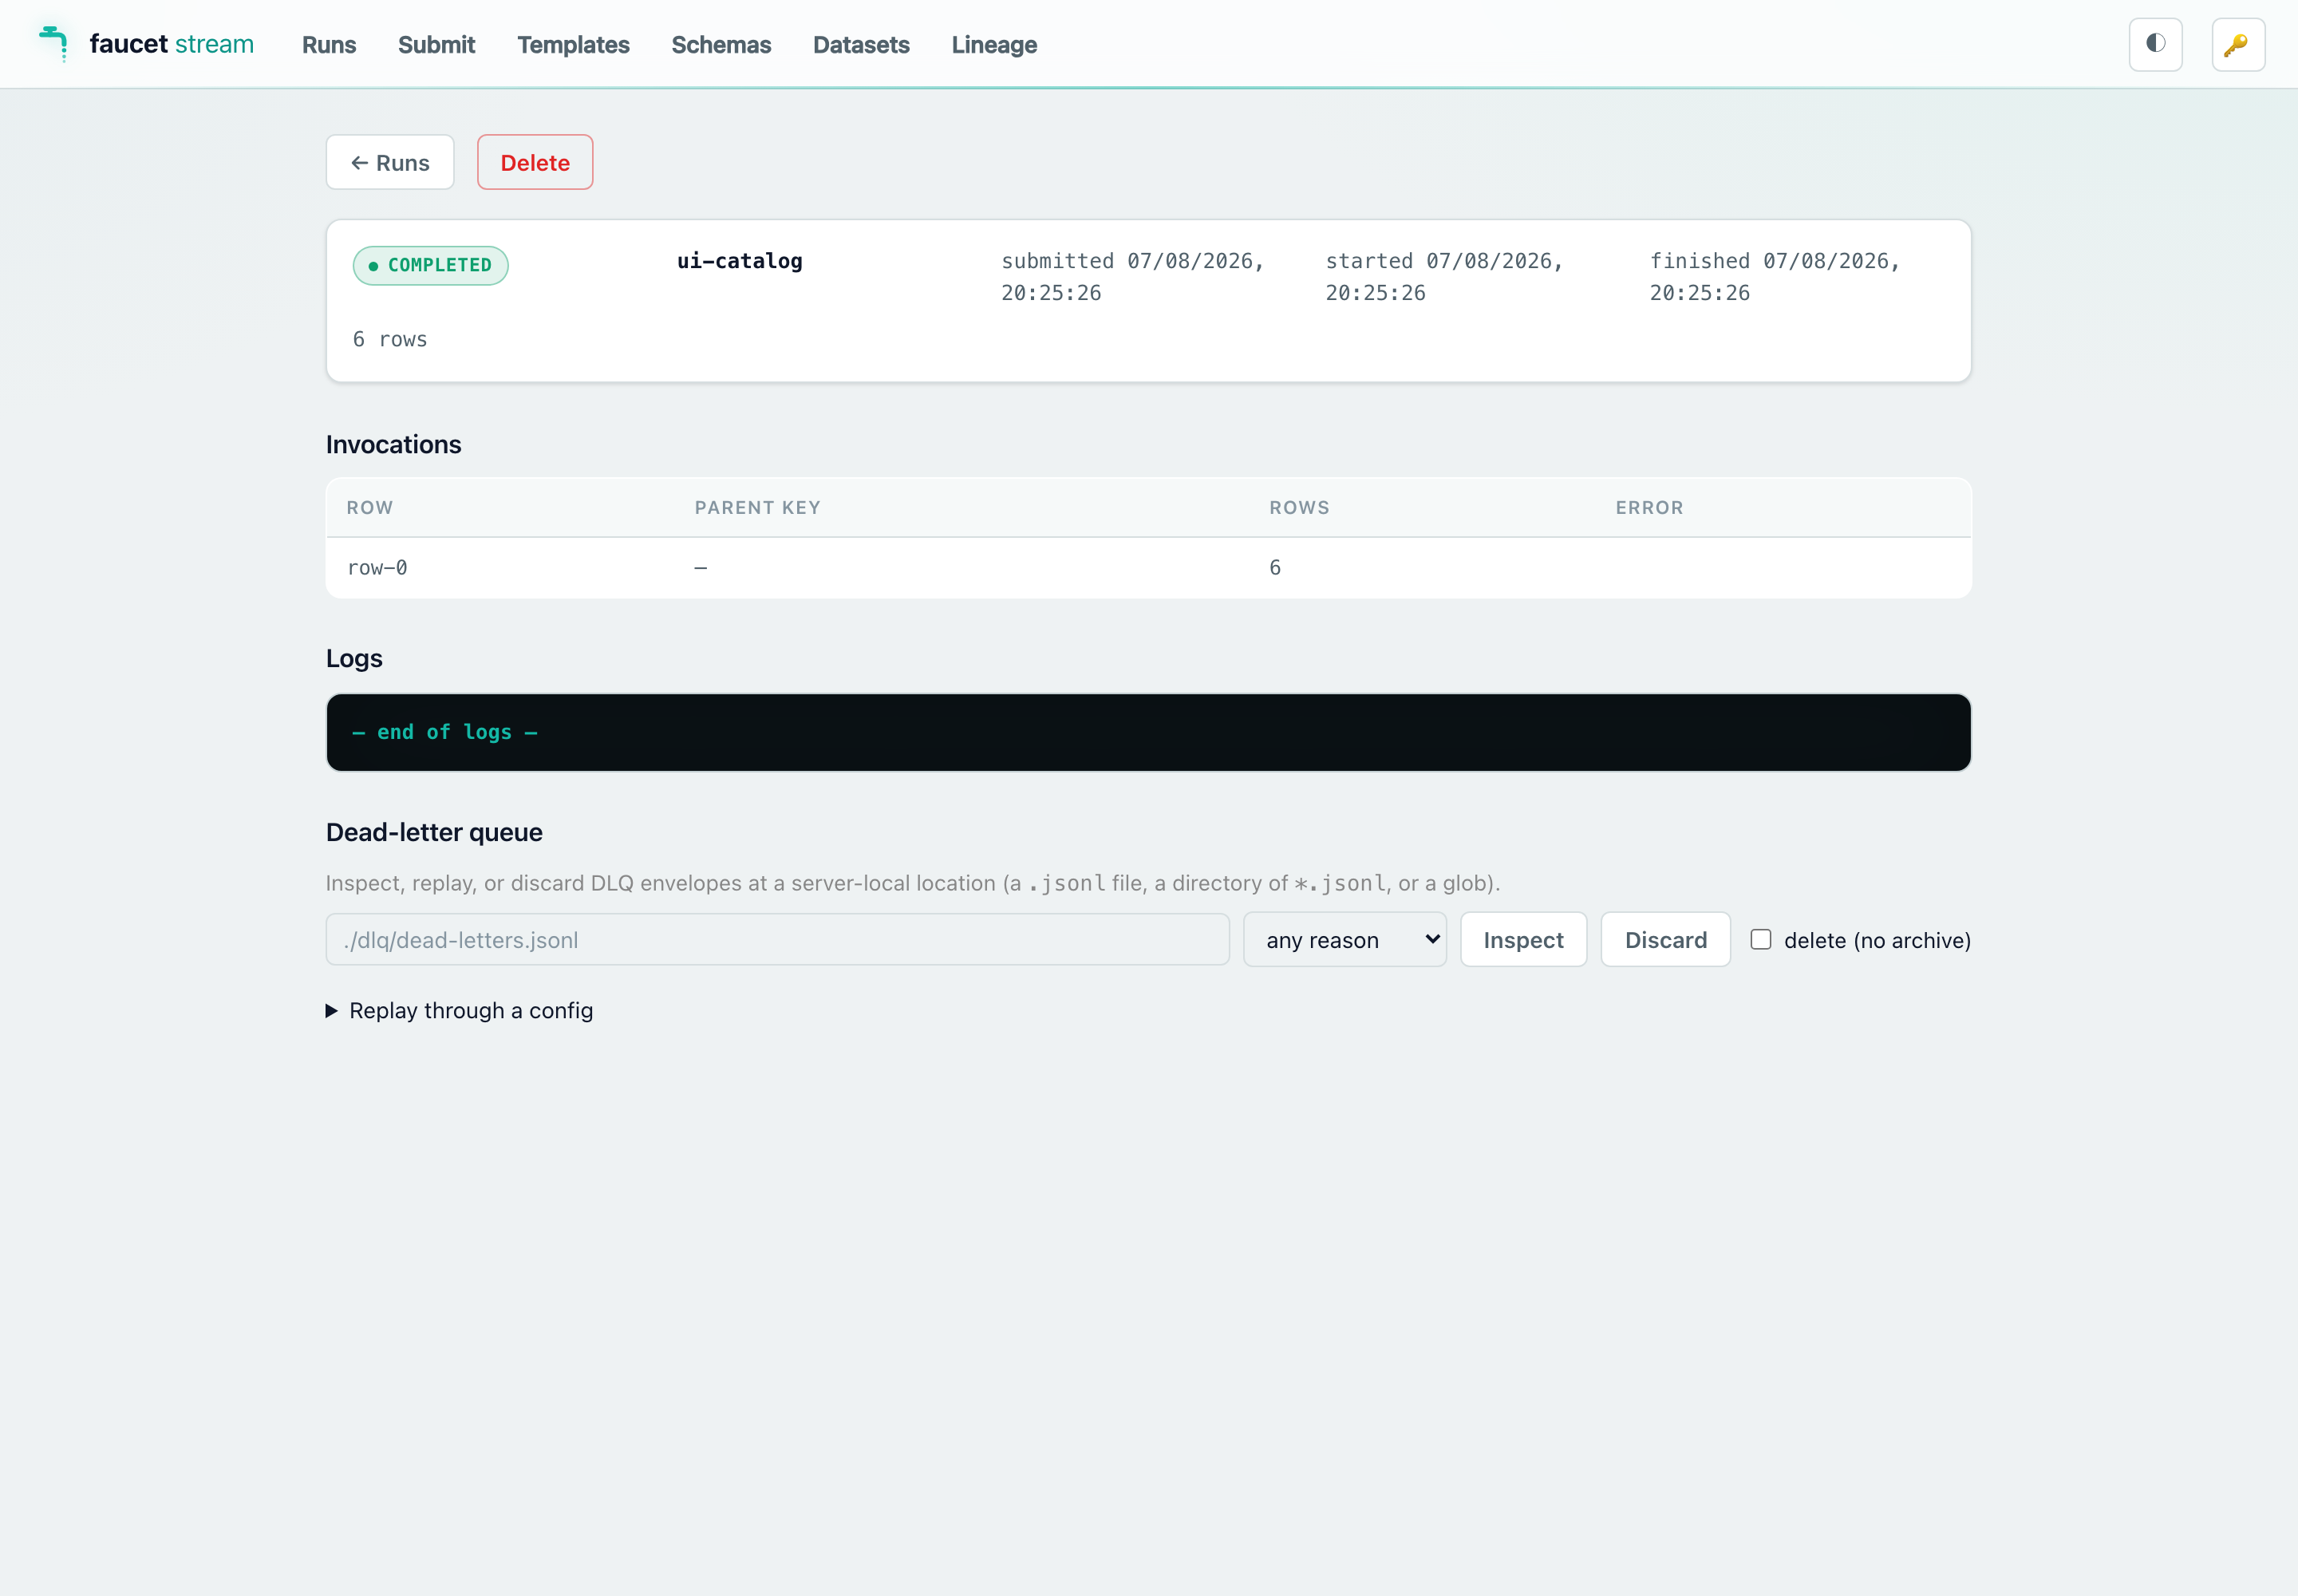
A selected run has tabs:
- Overview: status, what it moved, the row accounting (accepted, coalesced, filtered, quarantined, dead-lettered — every row offered is accounted for), invocations, governance outcomes, provenance (template, pool, who submitted it, labels — click a label to filter runs) and the datasets it read and wrote. A failed run leads with its error and links to the log line and to a comparison with the last good run.
- Invocations, Logs (live while the run is going, with level filters),
Config (the stored config, credentials masked —
GET /v1/runs/{id}/config; re-run it or open it in Submit), Dead-letter queue (inspect, replay or discard, prefilled with the run’s own DLQ) and Compare (against another run of the same pipeline). - Cancel, Roll back… and Delete sit in the header and the ⋯ menu, each behind a confirmation.
Changes
Section titled “Changes”On a server started with --require-approval, Changes lists the change
requests (#/changes/<id>): Needs me and All tabs, a stat strip from
GET /v1/changes/counts, and sections for pending, executed and closed
requests. A request shows its plan (what the run, registration or launch will
do), its impact on downstream datasets, the approvals so far and its history;
Approve and Reject (with a reason) follow the server’s approval policy.
A data-flow policy change shows the YAML diff and, under Impact, the
templates and recent runs it would newly refuse or allow; its requester sees
Withdraw instead of Approve.
Policy
Section titled “Policy”Policy (#/policy) shows the data-flow policy the server
enforces:
- Rules — what is in effect (rules, labels, sinks that declare attributes, refusals in the last 7 days), the classifications with how many catalogued columns each label matched in the last 30 days, and the rules: what each covers, what satisfies it, and what happens at run time.
- Refusals — the submissions and runs the policy stopped, with the rule, column and sink, filterable by tenant.
- Dry run (operator) — paste a config, or pick a pipeline template, and check it without running it; violations come with how to fix them.
- History — the versions of a server-managed policy, who requested and approved each, and Roll back to vN (a change request too).
On a server started with --policy FILE the page says so and is read-only. On a
server-managed policy an admin’s Edit policy opens an editor that validates
as you type (problems with their line), then Preview impact shows the diff
and the templates and recent runs the draft would newly refuse or allow, and
Request change — with a required reason — creates the change request a
second admin approves. A pending change shows as a banner until then. With no
policy at all, Write a policy starts from an example.
With the tenant switcher set to a tenant, the page shows the server rules beside that tenant’s add-only rules and their history, with Edit acme rules for admins. A tenant principal sees the server rules that apply to it (names and what they require), its own rules, its refusals and their history; its admins edit its rules, its viewers and operators read them.
Triggers
Section titled “Triggers”Triggers lists the event triggers loaded from --triggers
(GET /v1/triggers): type, store or webhook methods, health, last fire and
fire / error counts. Cron schedules have their own page. A webhook trigger shows a ready-to-paste curl and a
Fire button; a trigger in error backoff shows its last error. Without a
triggers file the page says how to add one.
Schedules
Section titled “Schedules”Schedules lists every schedule with its next tick, grouped into Needs
attention, Active and Paused, with counts of ticks today and missed
ticks (GET /v1/schedules). A schedule’s page shows its next ticks in its
timezone and in UTC, what it runs (template, version, params — secret ones
as sealed), its tenants, recent ticks with their runs, missed ticks and its
change history, with Run now, Pause/Resume, Edit and
Delete. New opens a form that builds the params from the template,
previews the next ticks as you type the cron, and becomes Request
approval under --require-approval schedule. Schedules from the
--schedules file are read-only. With a tenant picked in the switcher the
page shows the schedules that run for it, and its runs only. See
Schedules.
Submit
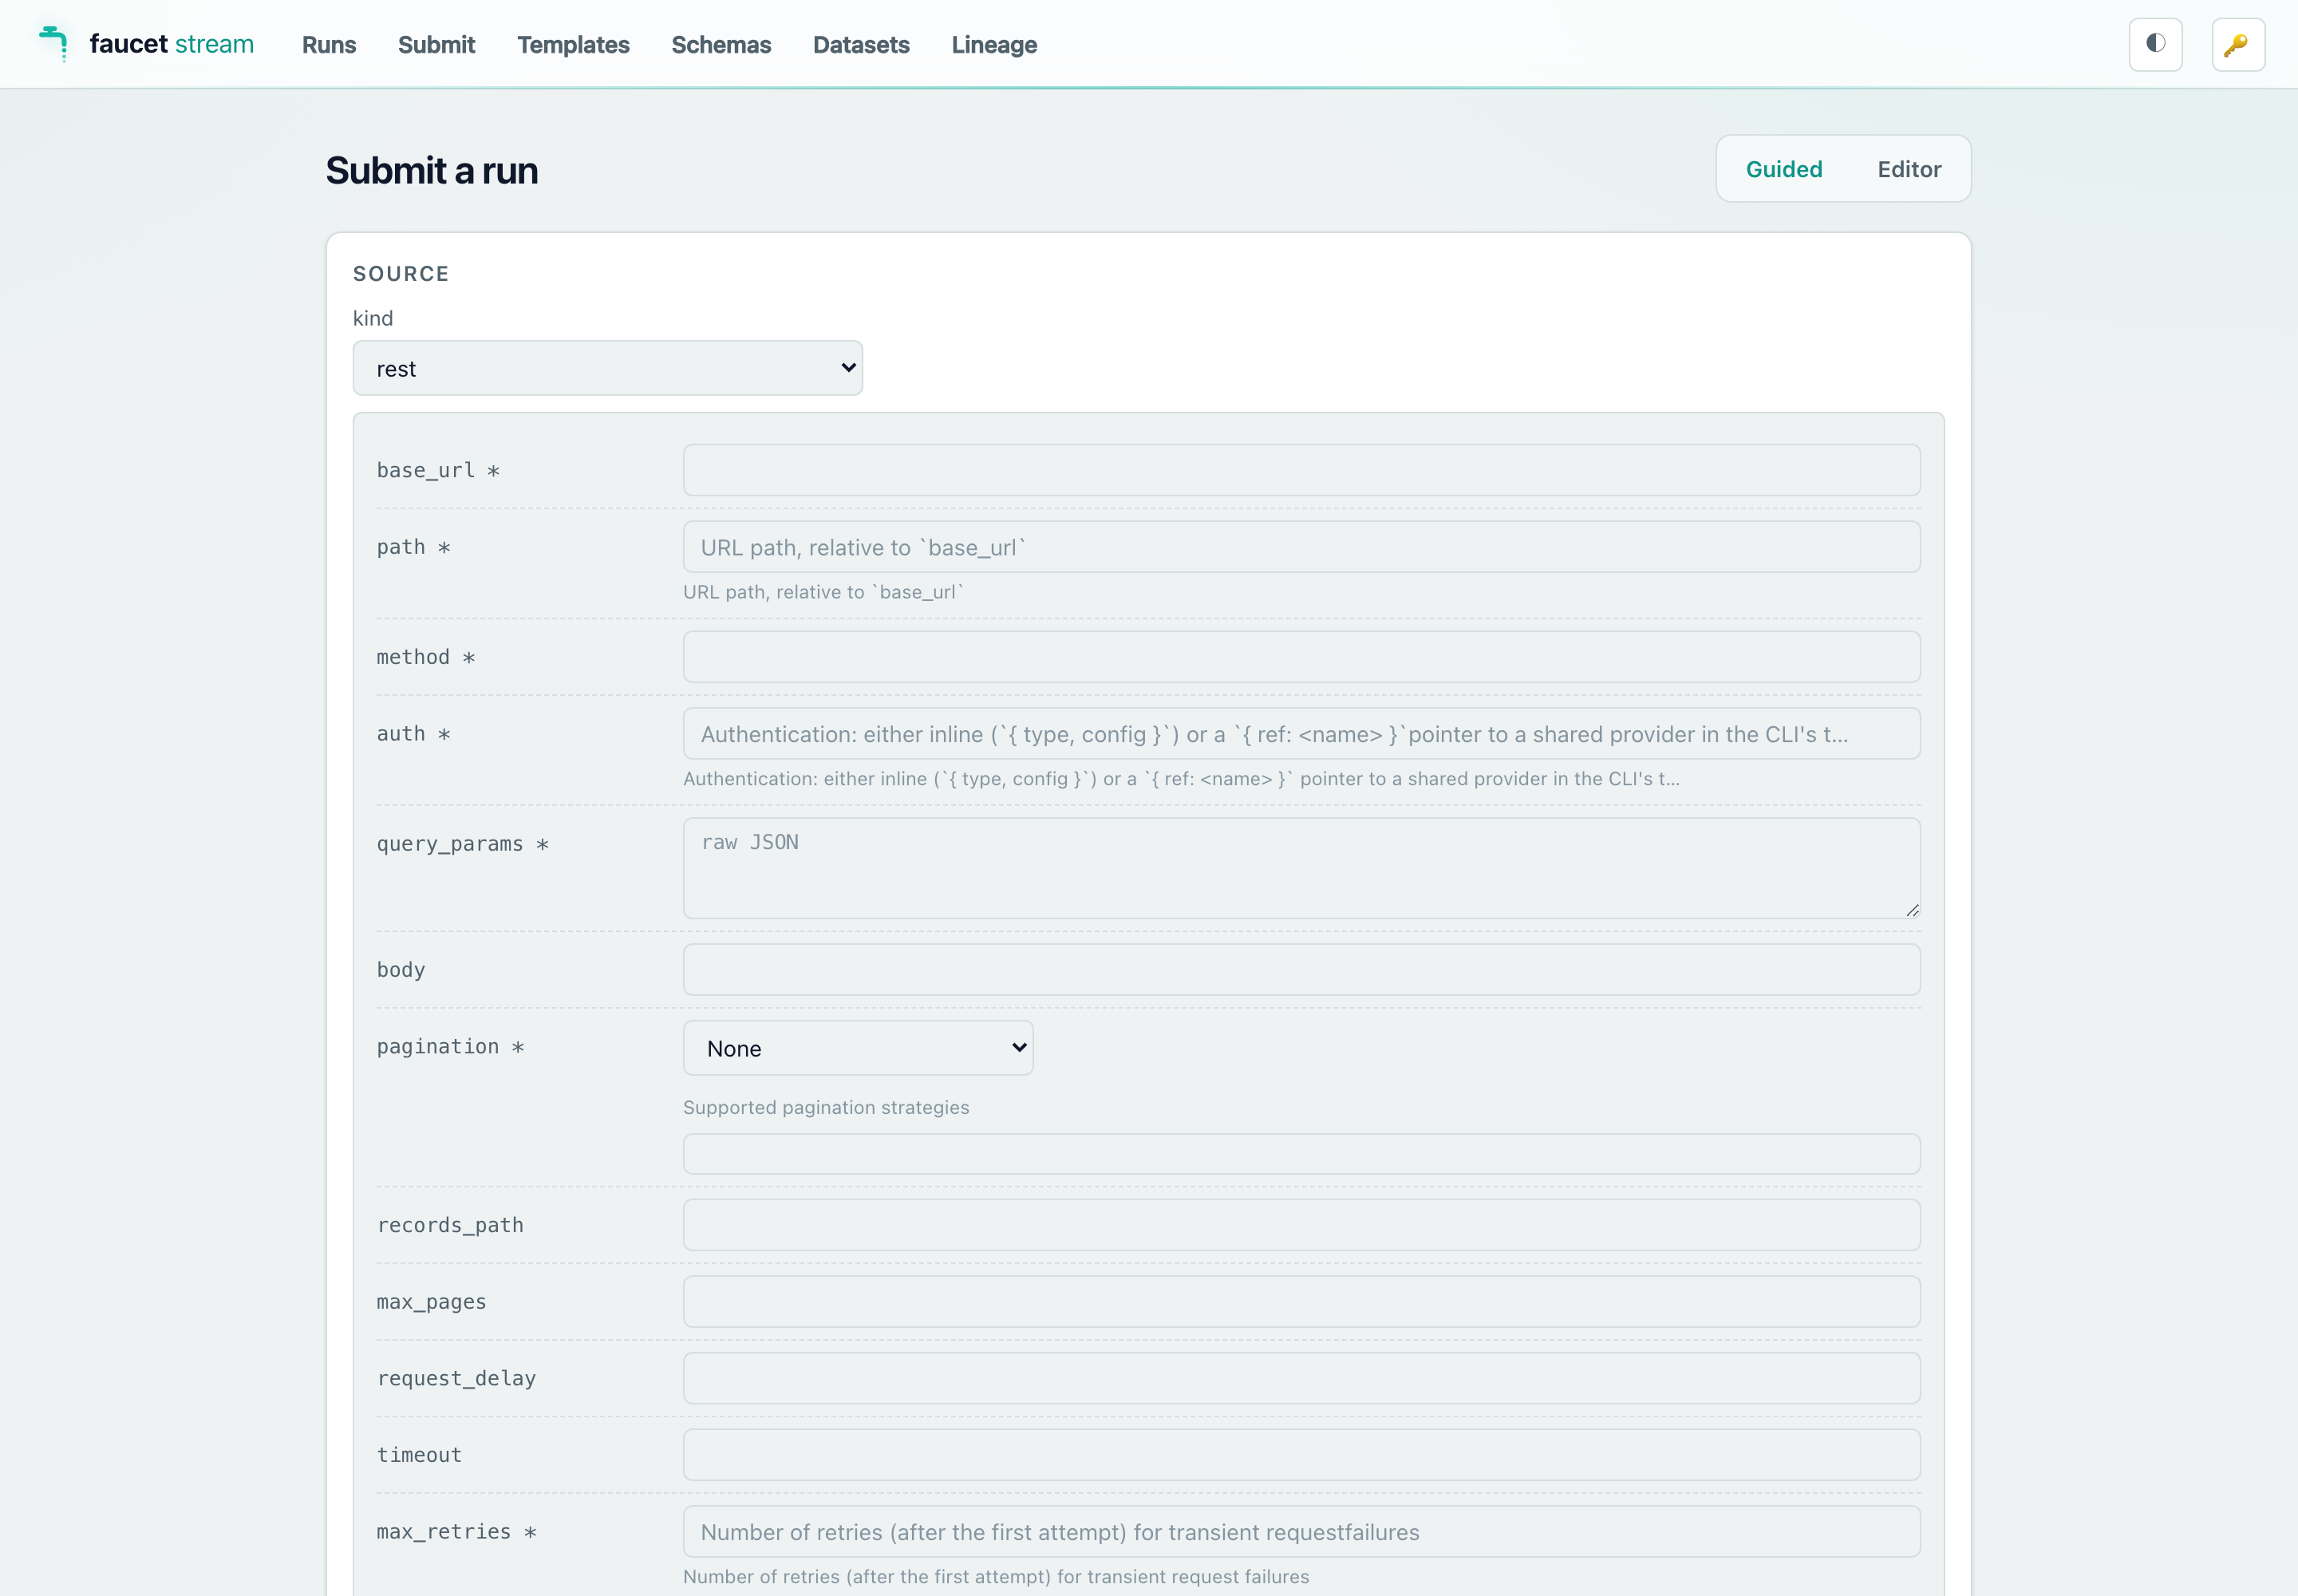
Section titled “Submit”Submit builds a pipeline config and runs it, step by step: Source,
Transforms, Sink, Options, Review. Guided mode generates a
form from each connector’s schema; Editor mode takes YAML or JSON. The live
preview on the right shows the config as it will be sent. Validate probes
it with the doctor, Plan shows what the run will do, and Submit run
starts it — or, when approval is required, Request approval creates a
change request. #/submit?from=<run id> starts from a past run’s config;
Schemas’ Use in Submit starts from one connector.
Schemas
Section titled “Schemas”Schemas lists every source, sink, transform, pipeline block (masking,
quality, contract, policy, schema drift, DLQ, SLA, …) and state store compiled
into the server, with search and tabs. Each one (#/schemas/<kind>/<name>,
kind = source / sink / transform / block / state) shows its fields
with type, default and description — click a field for its full description,
values and constraints — an example config like faucet init (a block in the
place it goes in a config, a state store as its state: block), the raw JSON
Schema, and Use in Submit.
Usage groups the recorded usage (GET /v1/usage) by pipeline, row,
dataset, sink, day or tenant over a date range, with sortable columns, a daily
chart and a CSV download; click a row to drill into it.
Templates
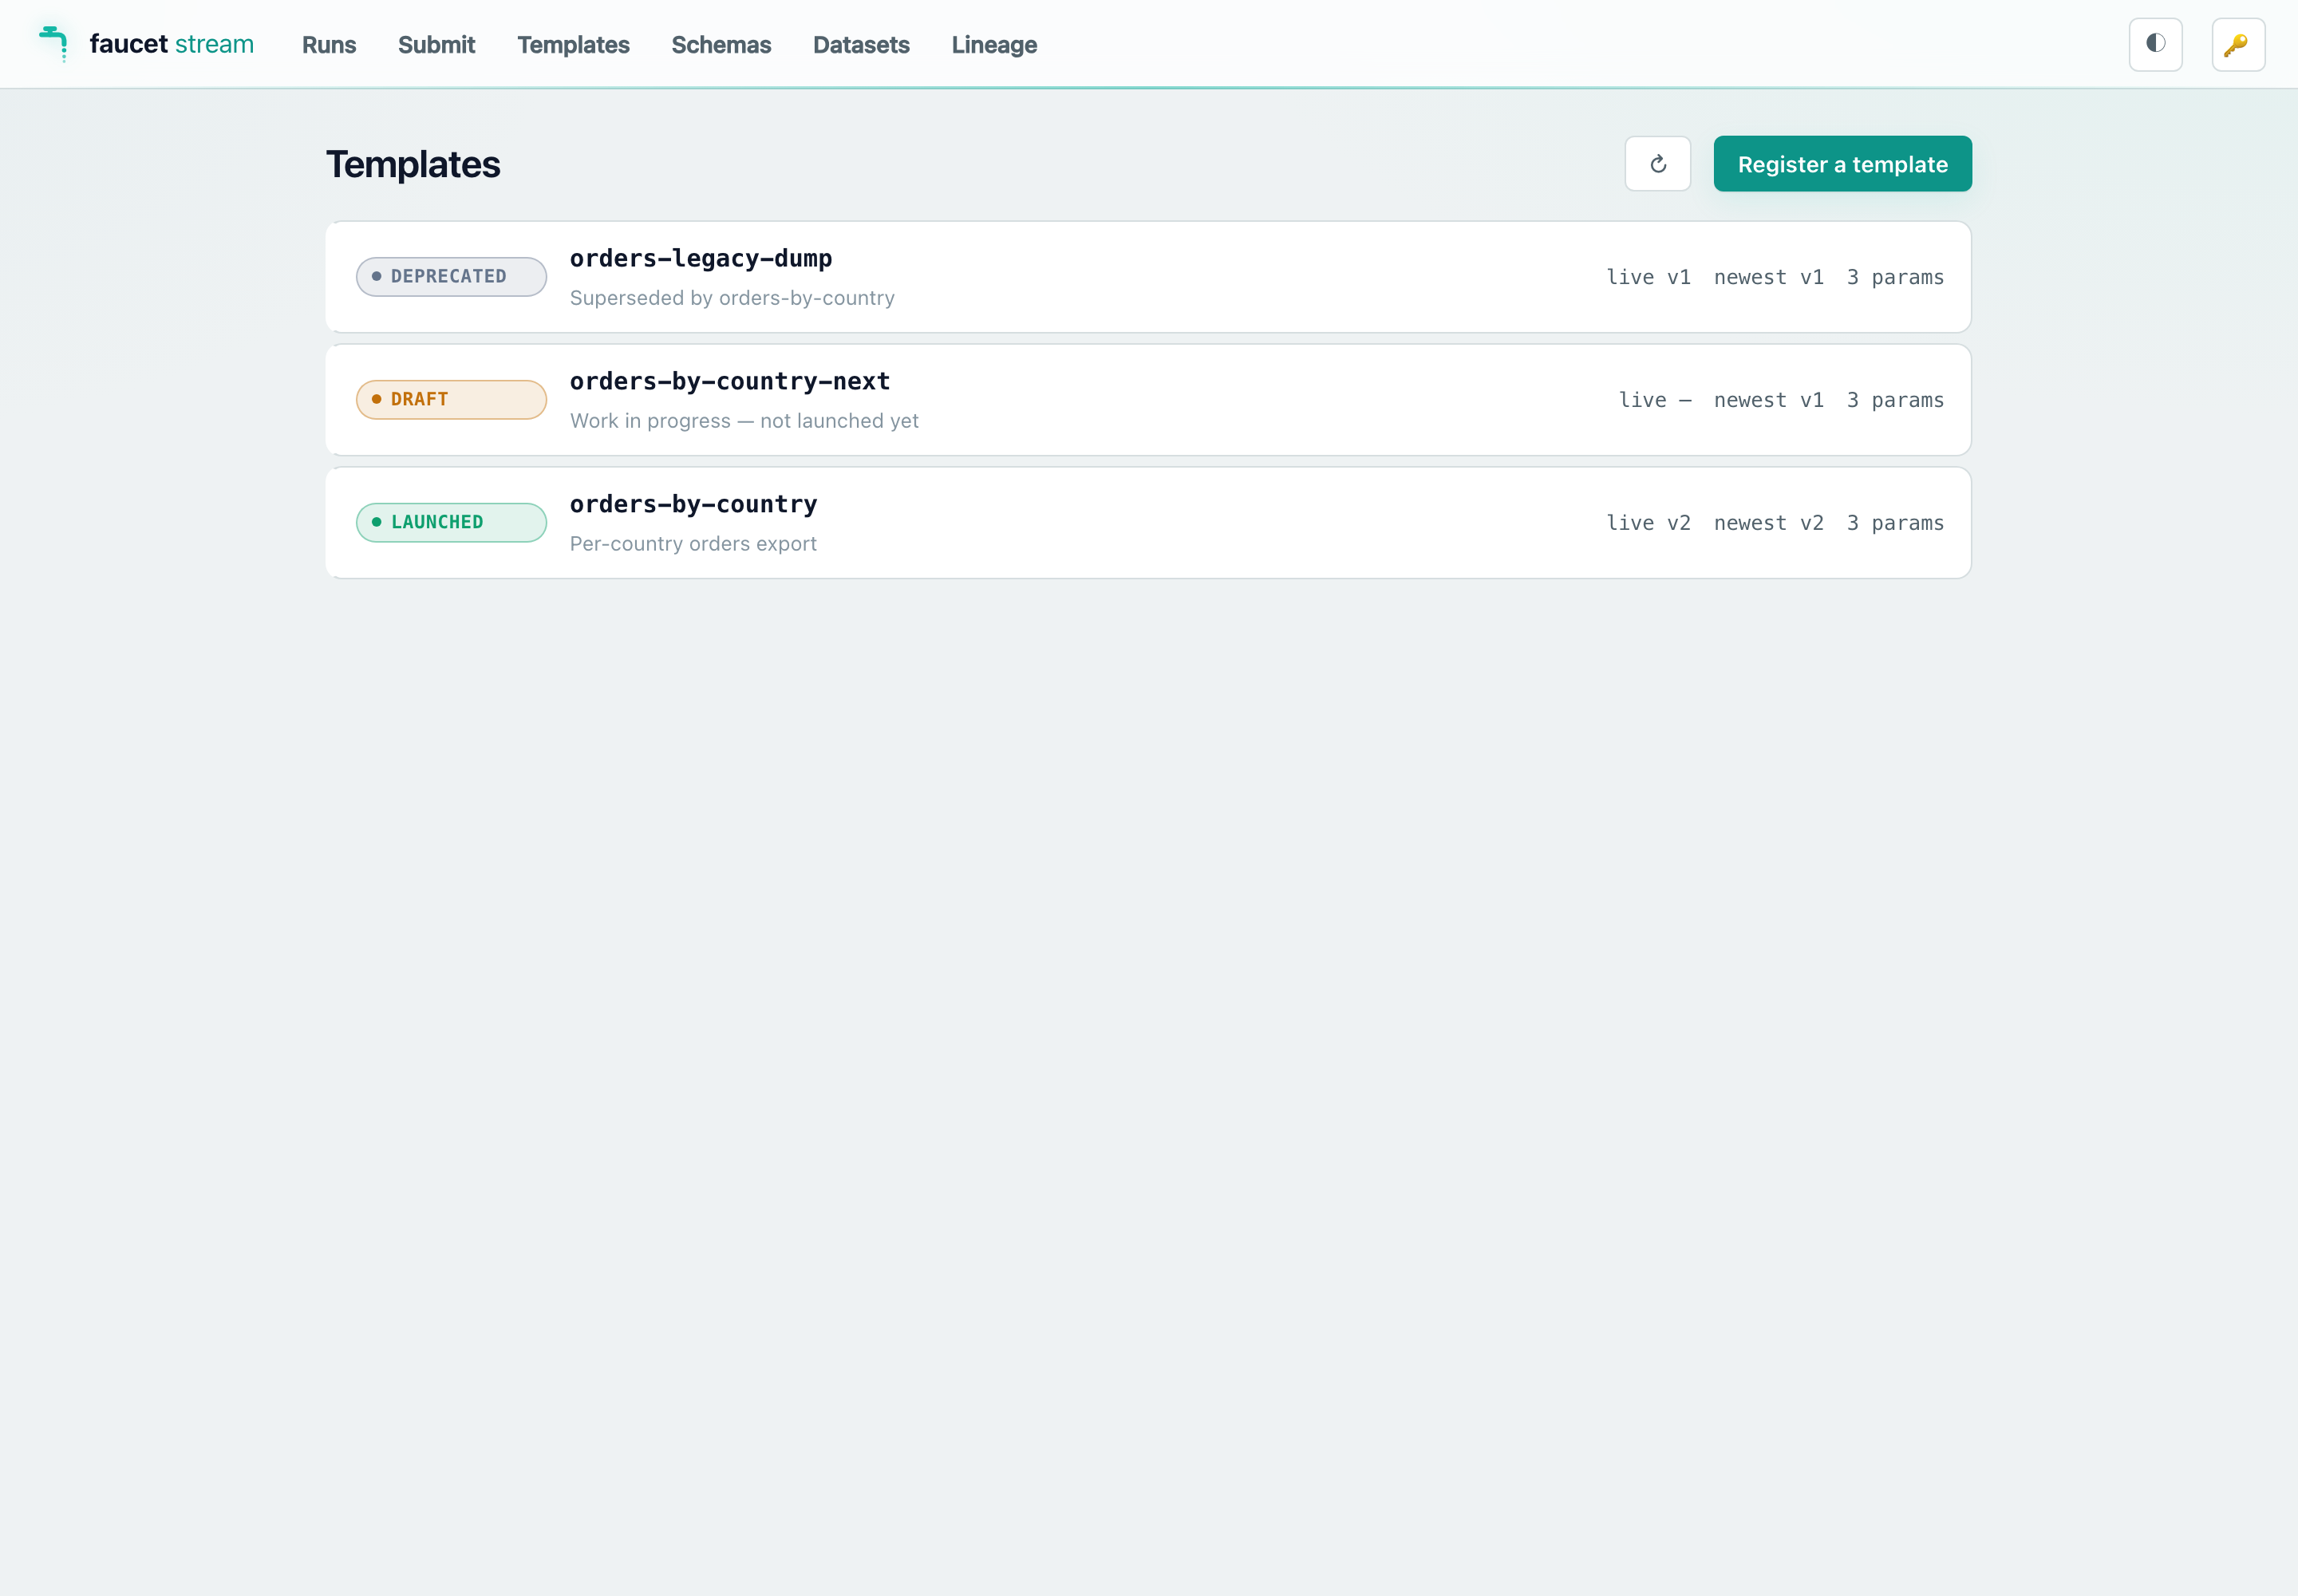
Section titled “Templates”Templates is a split pane over the template registry:
sections for source templates, sink templates, pipelines and deployments, each
row with its stable version and status. With nothing selected the detail pane
holds the registry views: the Matrix of source × sink pairings, Register
(paste a document; the server tests it if it has a tests: block) and Sync
from configured origins.
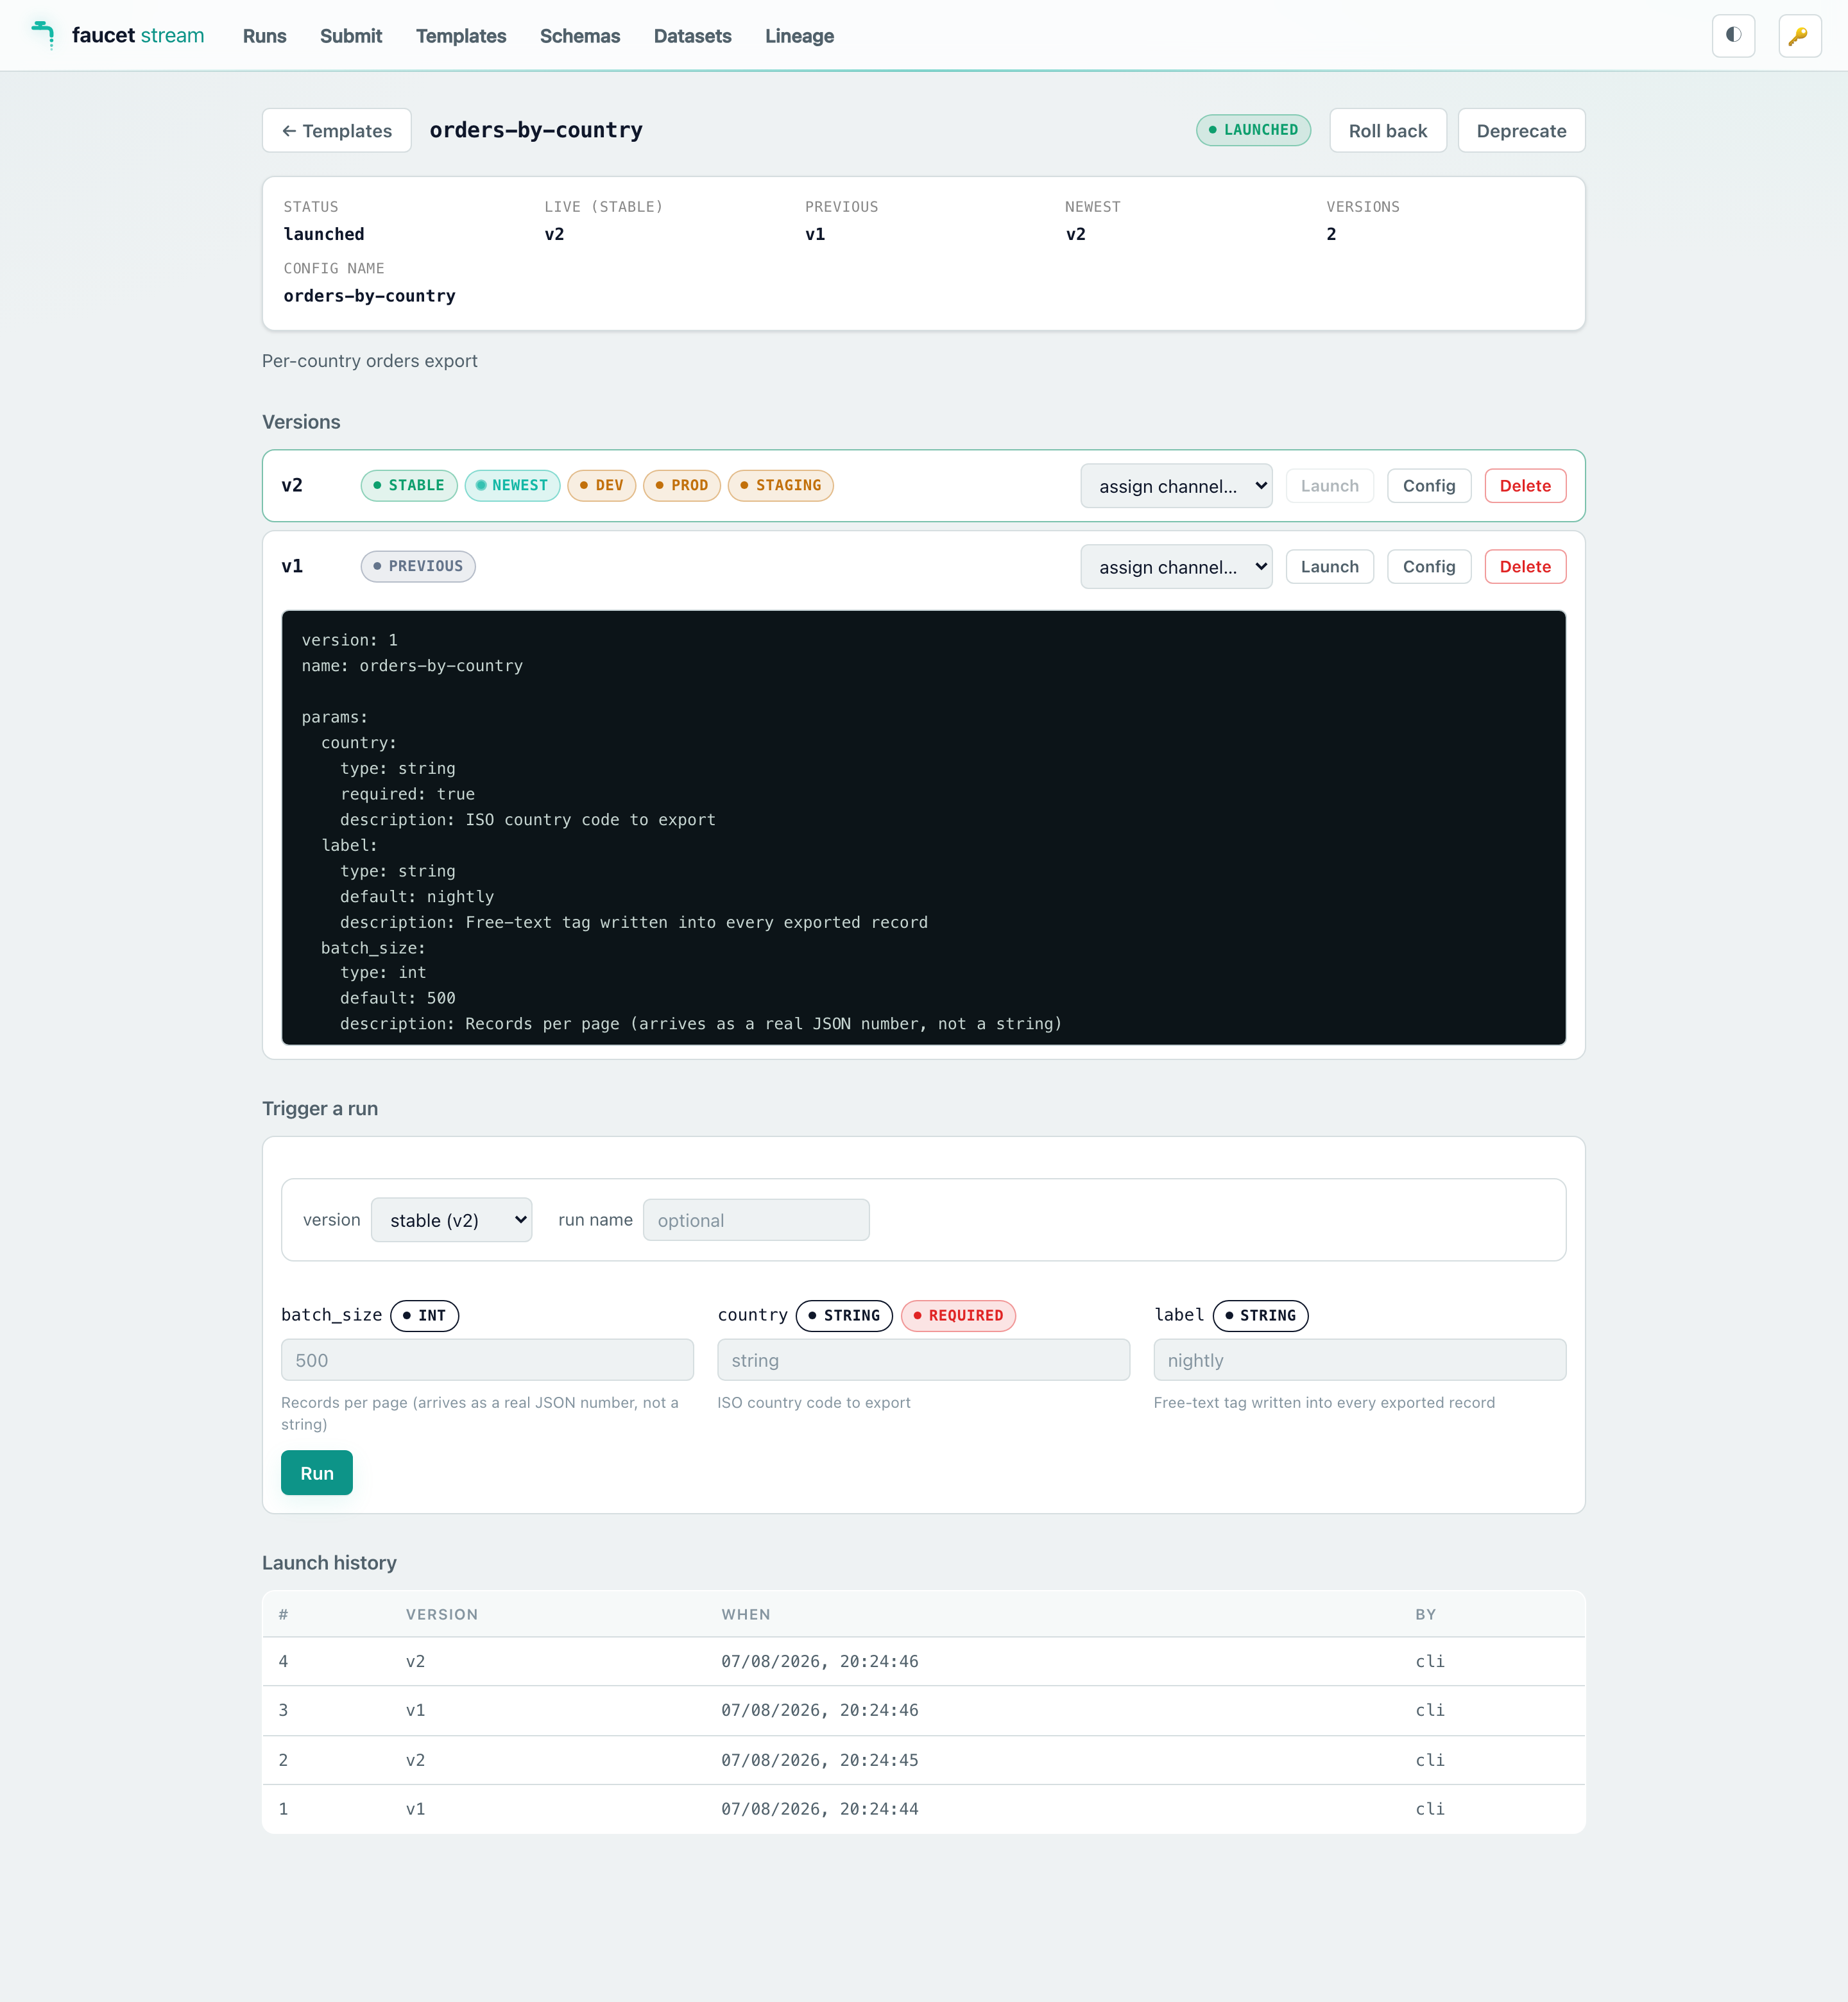
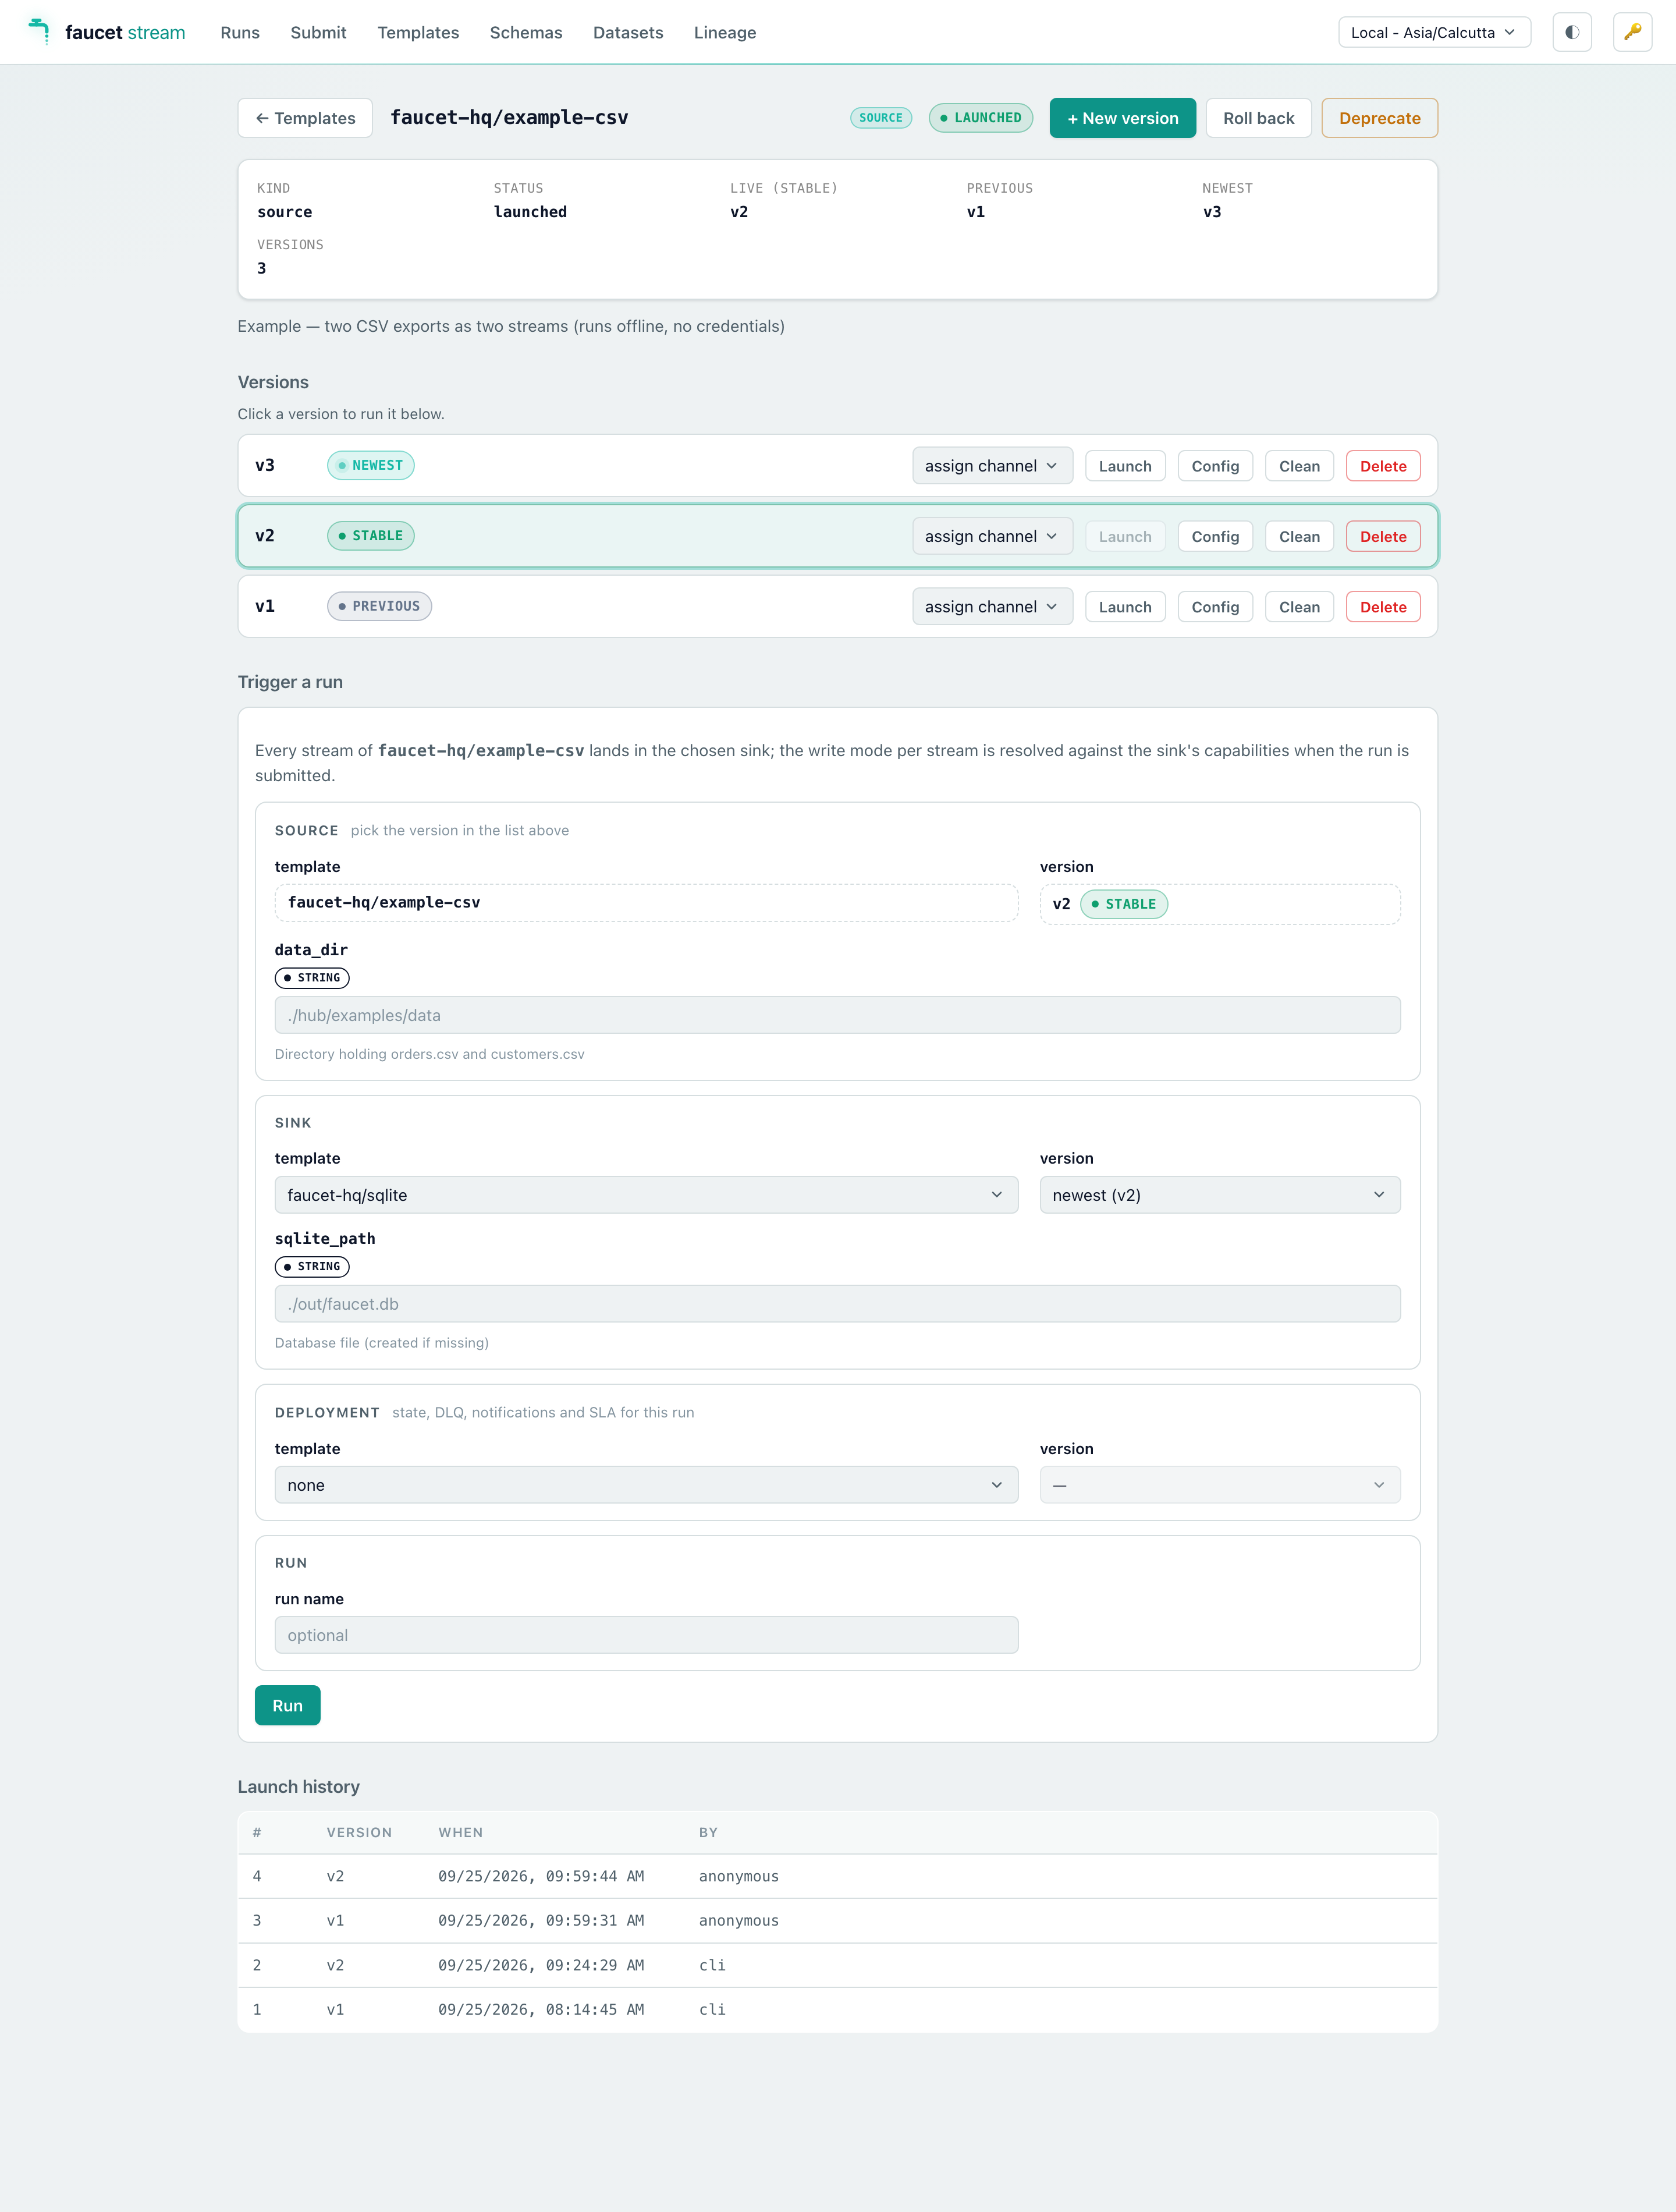
A template (#/templates/<id>) has tabs:
- Overview: its lifecycle (registered → tested → launched), params, streams and who uses it.
- Versions: every version with its channels, test status and runs in the last 7 days, Run and a ⋯ menu (assign a channel, run tests, show config, deprecate, delete); Compare diffs two versions; Launch, Roll back and New version sit in the header; the launch history below.
- Tests: the test bundle and its results per version.
- Run: a form generated from the template’s
params:, the sink template and overlay to pair a source template with, and the streams to run with the resolved run set. - Pairings (source templates) and Activity (its runs and registrations).
Datasets & Lineage (Data Movement Catalog)
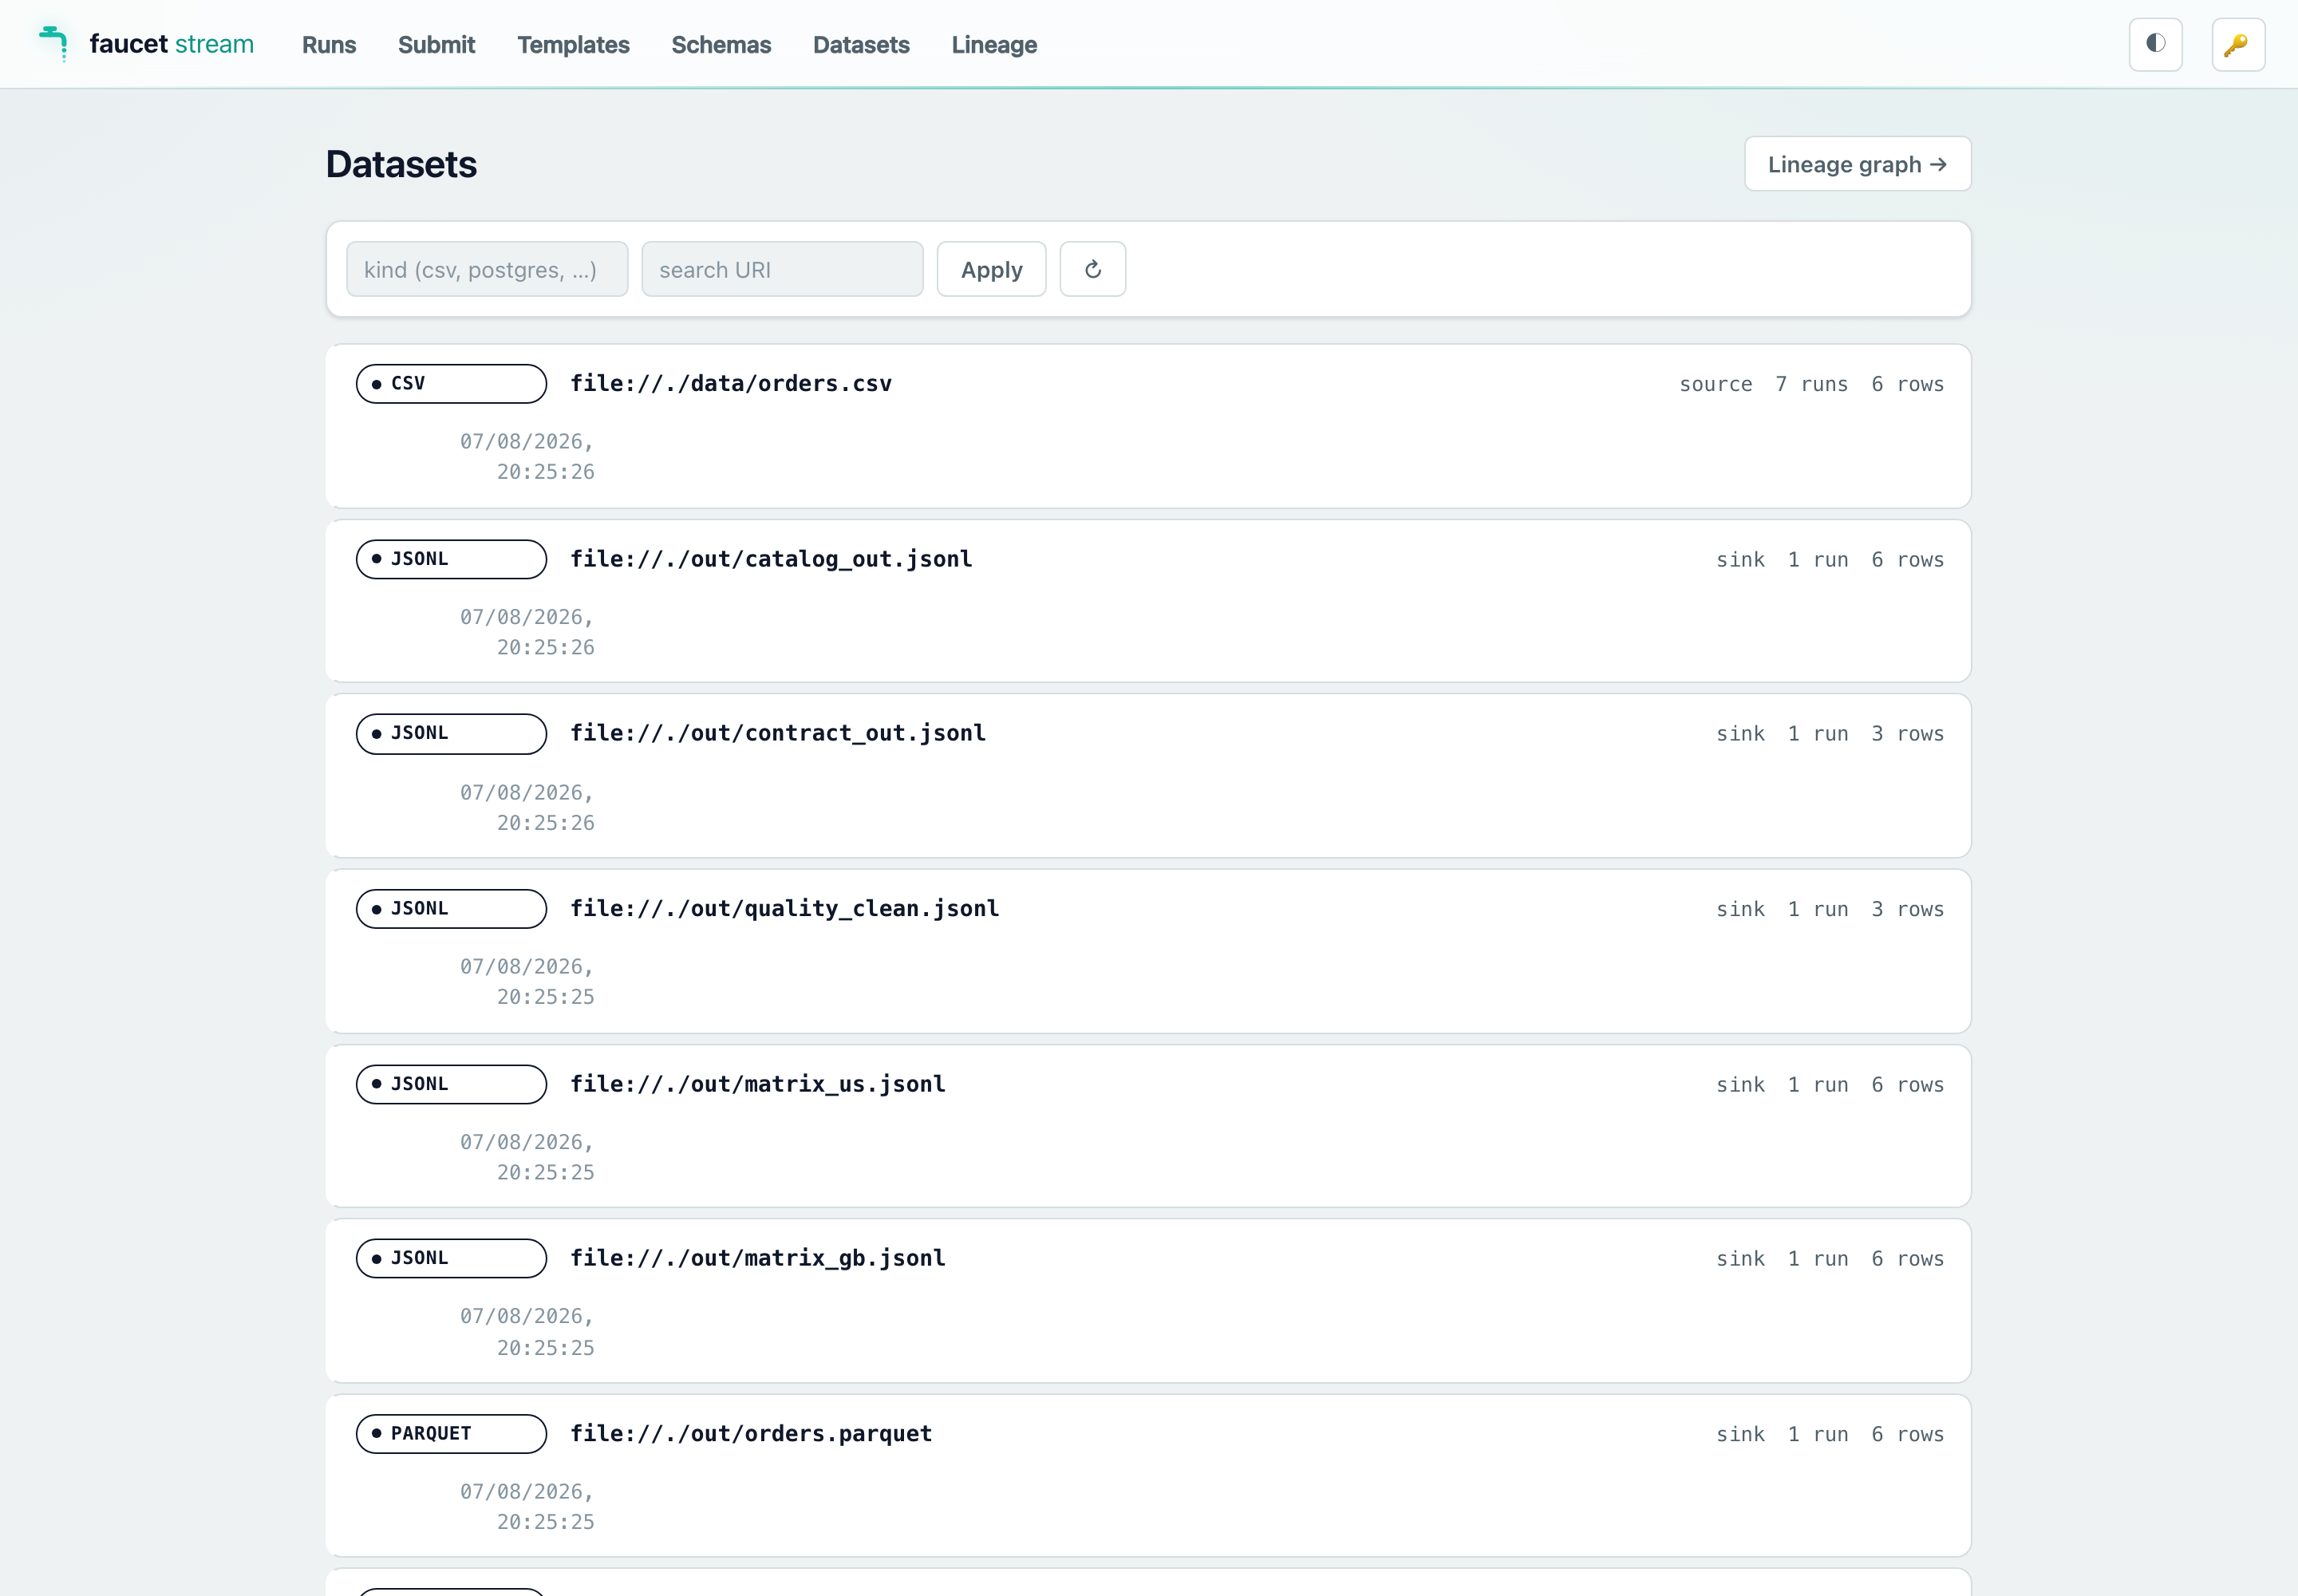
Section titled “Datasets & Lineage (Data Movement Catalog)”On a server built with the catalog feature, Datasets lists every dataset
a pipeline has read or written (#/catalog/<id>): All / Destinations /
Sources tabs, filters, and freshness at a glance. A dataset has tabs:
- Overview: rows, columns, rows per run, null rates, usual cadence, consumers, a small lineage graph, owners and consumers, and the runs that wrote it.
- Schema: the schema timeline; compare any two versions.
- Profile: column profiles and drift findings.
- Lineage, Activity (runs that read or wrote it,
GET /v1/runs?dataset_id=) and Outputs (local files, below). - Annotate records owners and consumers (
catalog_annotate).
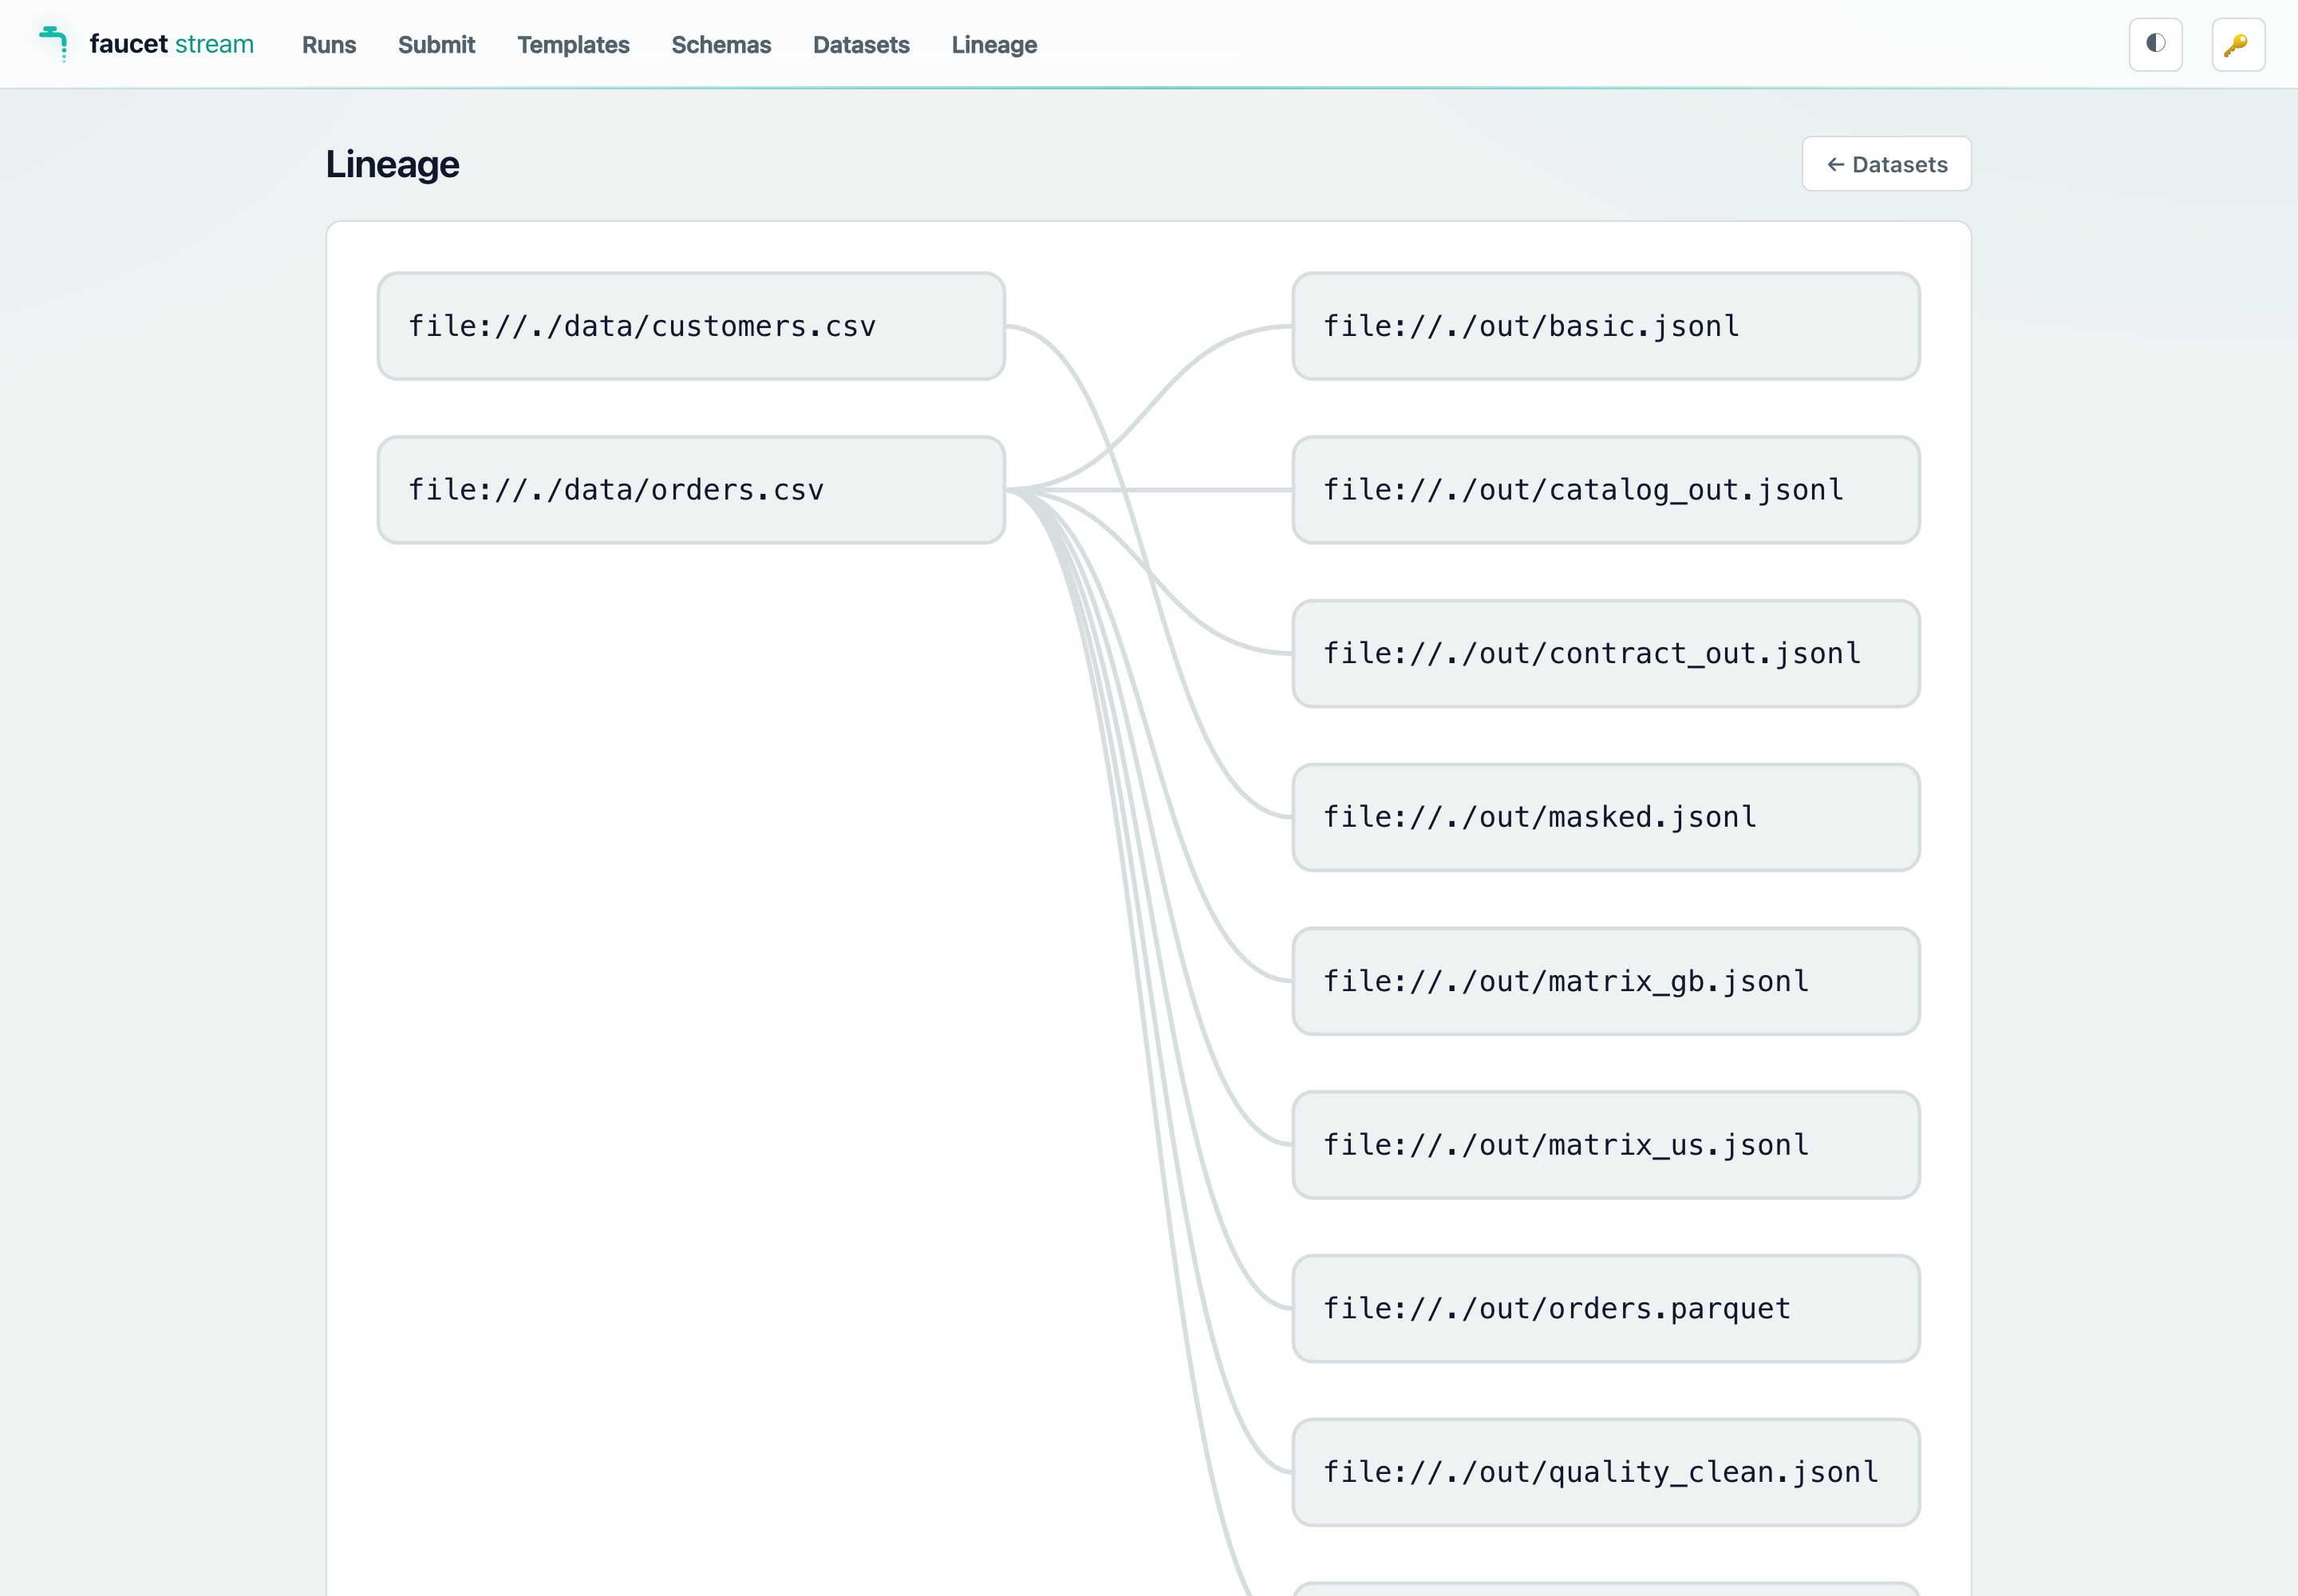
Lineage draws every dataset and the pipelines between them: drag to pan, scroll to zoom, fit and a minimap; pick a dataset to focus on it with a number of hops up and down, see it in the side panel, and trace one column through the graph.
Cleaning up local outputs
Section titled “Cleaning up local outputs”The Datasets page is also where the local files the server’s sinks wrote (jsonl / csv / parquet) are listed and reclaimed — cleanup of data artifacts belongs next to the data artifacts, not on the Runs tab, which is about execution history. A Local outputs panel fills the Datasets detail pane while no dataset is selected (the list’s outputs button opens it), and each dataset’s Outputs tab holds the same panel scoped to that dataset. Each tracked file shows its age and state:
| State | Meaning |
|---|---|
present |
on disk |
expired |
already cleaned — the file is gone, the record is kept |
external |
faucet wrote this file but did not create it (appended to it), so it is never cleaned and never previewed |
replaced |
the file already existed, but faucet truncated it, so it holds only faucet’s output — previewable, still never cleaned |
Controls, when your role holds LocalOutputManage (operator and up — a
viewer sees the list and no buttons):
- Delete now on any
presentoutput. - Purge older than N days, prefilled with the server’s configured window. On a dataset’s detail page it purges only that dataset’s outputs.
- Clean all local outputs — behind a confirm, because it also removes files still inside their retention window. On a dataset’s detail page the same button is scoped to that dataset.
The model to keep in mind: data artifacts are disposable; run history is
durable. Cleaning an output removes the file — the run record is untouched,
so the Runs tab still shows what ran, and the output re-renders as expired
rather than as a broken row. Only files faucet created are ever deleted (never a
glob, never a directory); a skipped file always comes with the reason, so a “0
files” result never looks like a broken button. The same operations run
automatically on a timer — see
Local output retention.
Previewing what a run actually wrote
Section titled “Previewing what a run actually wrote”“12 records written” tells you the run finished. It does not tell you whether the
transform did what you meant. On a server started with
--preview-local-outputs, each tracked jsonl / csv / parquet output in the
Local outputs panel grows a Preview button: it expands inline and renders
the file’s first rows as a table, with a row-count input bounded by the server’s
own cap.
500 rows load by default; the row box takes any number up to the server’s ceiling, and All rows asks for the whole dataset:
# Local iteration loop: previews on, 500 rows by default, ceiling at 5000.FAUCET_SERVE_AUTH_TOKEN=s3cret faucet serve --preview-local-outputs
# …and with no ceiling, so "All rows" really loads the whole file.FAUCET_SERVE_AUTH_TOKEN=s3cret faucet serve \  --preview-local-outputs --preview-max-rows 0
What the table shows:
- Columns are the union of the records’ fields, so a field only some records carry still gets a column — a preview never hides something that was written.
- A missing field renders
—and anullone rendersnull; they are different facts about the record. - The status line always says which it is: “whole dataset”, or “stopped at the row limit — the dataset has more”. 500 rows of a million-row file can never be mistaken for the file, and a complete read says so rather than leaving you to infer it from the absence of a warning.
- A record that is not a JSON object (a bare scalar or array per line — legal NDJSON) is rendered across the row rather than as a line of blanks.
Under the hood it is a source-backed capped read: the server reads the output back through the matching source connector and stops once it has enough rows, so previewing a huge file touches only its first pages. There is no paging — these files are sequential streams with no row index, so “show me more” is just a larger limit, which is why the panel has a row box and an All rows button instead of Next page.
On a server with a ceiling, “All rows” gives you the ceiling (the status line says it stopped at the row limit). An uncapped server gives you everything — and still stops at a 64 MiB response budget or a 30-second deadline if the dataset is larger than that, saying which. A partial answer always names the bound that produced it.
A present or replaced output gets a Preview button. An expired one has no
file left, and an external one — a file faucet appended to but did not
create — is never previewed: the part that predates faucet is not faucet’s to
serve, which is the read-side twin of the retention GC’s refusal to delete it. A
replaced file also already existed, but faucet truncated it, so every byte
in it is faucet’s output; it is previewed, and still never cleaned. Each served preview is recorded in the
audit log as local_output.preview.
It is off by default and intended for local testing — it returns file
contents over HTTP, and reading needs only LocalOutputRead (viewer and up),
so enabling it lets every viewer see the data those pipelines wrote. Without the
flag no Preview button is rendered at all (the list response says the capability
is off), and a direct API call is refused with a 403 naming the flag. A preview
of an output that retention already cleaned shows the “cleaned up — the run
record is kept” message in place of the table, never an error toast. Full detail:
Dataset preview.
Tenants
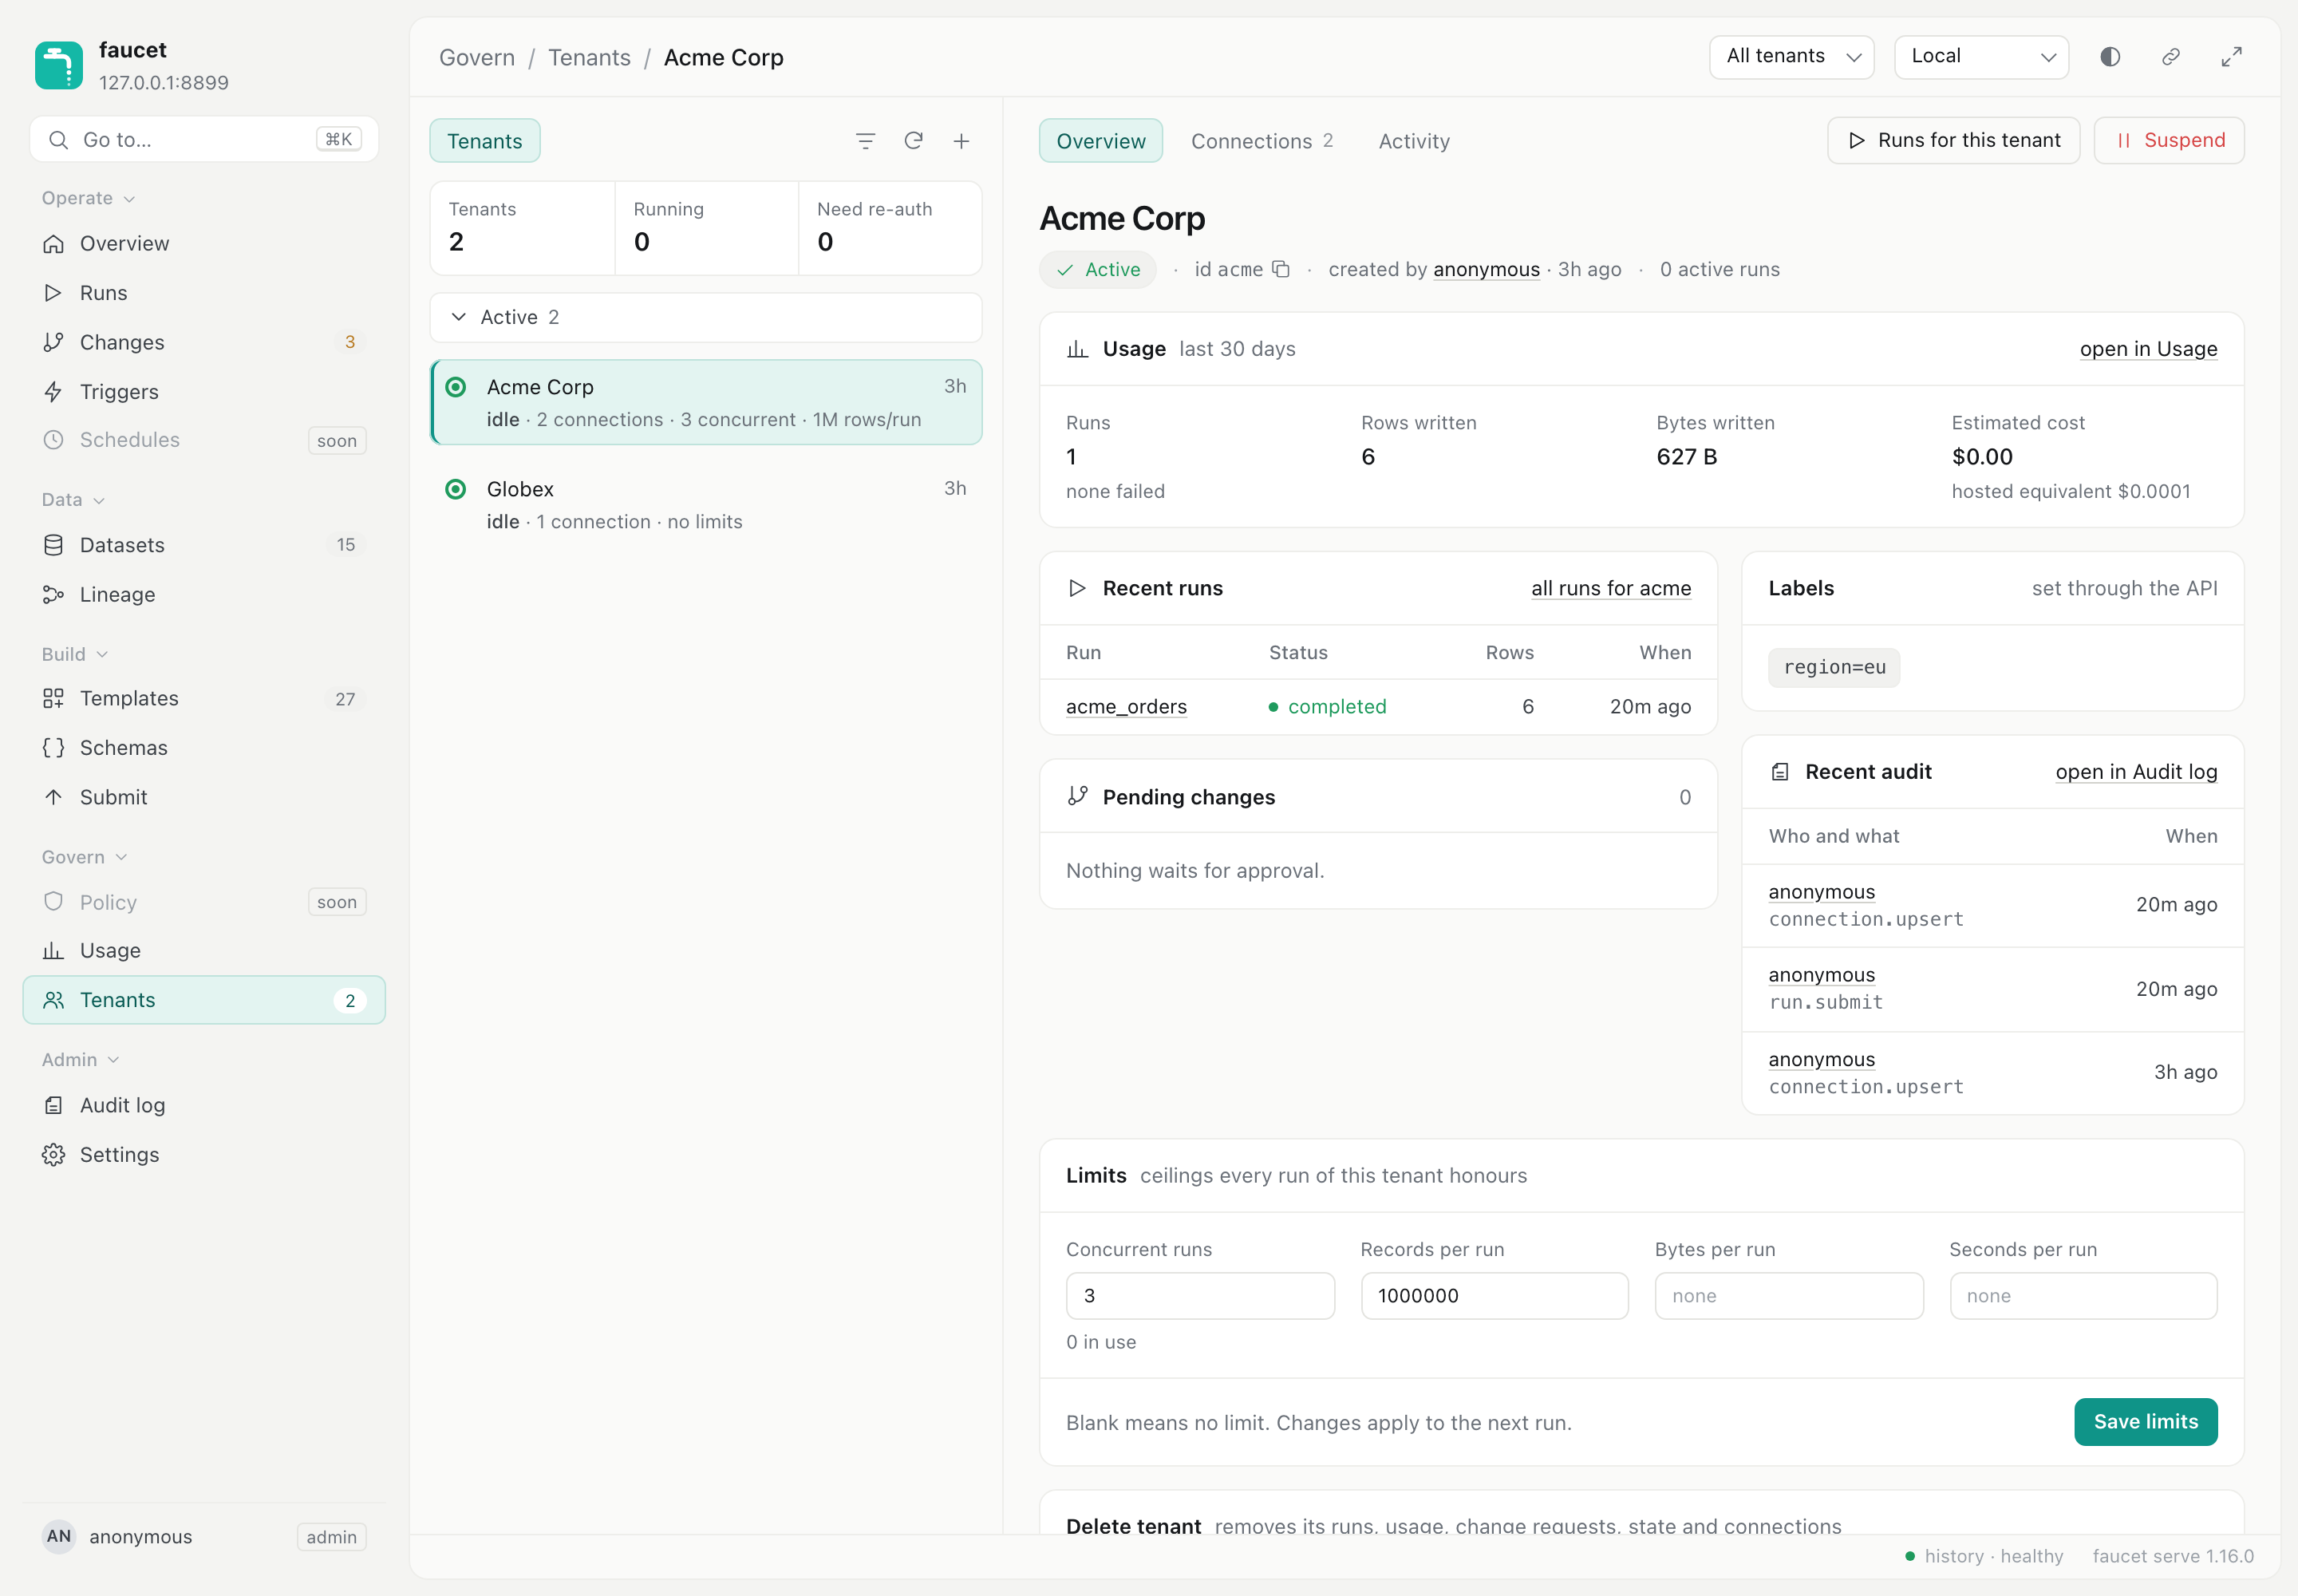
Section titled “Tenants”On a server built with the tenants feature, Tenants is a split pane over
the tenants (#/tenants/<id>), with active and
suspended sections and + to create one. A tenant has Overview (limits,
labels, recent runs), Connections (names, types and status — never
credentials — with a Connect flow per --connect-providers provider, stored
credentials, Reconnect and Delete) and Activity. Suspend /
Resume and Delete (type the id to confirm) sit in the header. Creating,
suspending and deleting tenants needs tenant_admin; connections need
connection_manage.
Audit log and Settings
Section titled “Audit log and Settings”Audit log (admins) lists every recorded action and denial (GET /v1/audit):
filters by principal, action, result and time, a Denials tab, and the
entry’s detail with the run it started (#/audit/<id>). Settings shows who
you are and what you may do, the access token, theme and time zone, the
keyboard shortcuts, the server (version, history backend, cluster replicas) and
the default config with Reload.
Disabling the console at runtime
Section titled “Disabling the console at runtime”If you built with serve-ui but want to serve only the API (no static assets),
pass --no-ui:
FAUCET_SERVE_AUTH_TOKEN=s3cret faucet serve --no-ui/ and /assets/* return 404; the /v1 API and the unauthenticated probes
(/healthz, /readyz, /metrics) are unaffected.
New API endpoints
Section titled “New API endpoints”The console calls these bearer-gated endpoints (any other client can too):
| Method | Path | Description |
|---|---|---|
GET |
/v1/schemas |
Catalog of all compiled sources, sinks, transforms, and state-store kinds. |
GET |
/v1/schemas/{kind}/{name} |
JSON Schema for one connector, transform, pipeline block, or state store’s config (kind ∈ source/sink/transform/block/state). Returns 404 for unknown kind or name. |
GET |
/v1/whoami |
The caller’s principal, role and permissions; the console uses it to hide controls the role cannot use. |
GET |
/v1/overview |
Fleet trends over the run history, behind the Overview page. |
GET |
/v1/runs/{id}/config |
A run’s stored config, credentials masked, behind the run’s Config tab. |
GET |
/v1/triggers |
The loaded triggers with health and fire counts, behind the Triggers page. |
GET |
/v1/schedules, /v1/schedules/{name} |
Schedules with their status, ticks and history, behind the Schedules page. |
POST |
/v1/schedules/preview |
The next ticks of a cron, for the schedule form. |
GET |
/v1/audit/{id} |
One audit entry, behind the Audit log’s entry links. |
POST |
/v1/doctor |
Validate and probe a submitted config without running it. Returns 200 (all probes pass) or 422 (any probe fails) with a probe report. Request body: { "config": "<yaml-or-json>", "config_format": "yaml" }. |
With the catalog feature the console also drives the local-output endpoints —
GET /v1/local-outputs, DELETE /v1/local-outputs/{id},
POST /v1/local-outputs/cleanup, and (with --preview-local-outputs)
GET /v1/local-outputs/{id}/preview — documented in the
HTTP API reference.
These endpoints require the serve feature and are available at runtime
regardless of whether --no-ui was passed.
Related pages
Section titled “Related pages”- Running faucet as a service — the full
faucet serveguide. - HTTP API reference — complete endpoint/schema reference.
faucet serveCLI flags — allfaucet serveflags.